

Quantifying the effect of uncertainty in input parameters in a simplified bidomain model of partial thickness ischaemia
- PMID: 28933043
- PMCID: PMC5906519
- DOI: 10.1007/s11517-017-1714-y
Quantifying the effect of uncertainty in input parameters in a simplified bidomain model of partial thickness ischaemia
Abstract
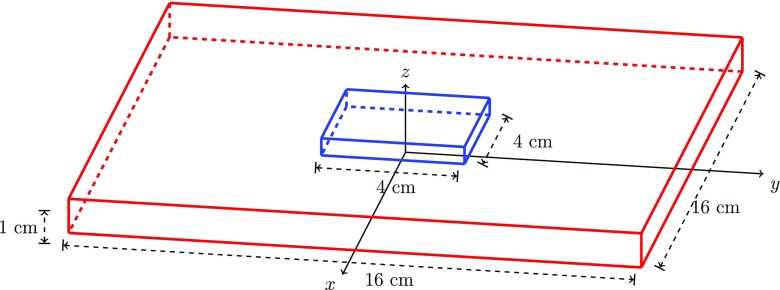
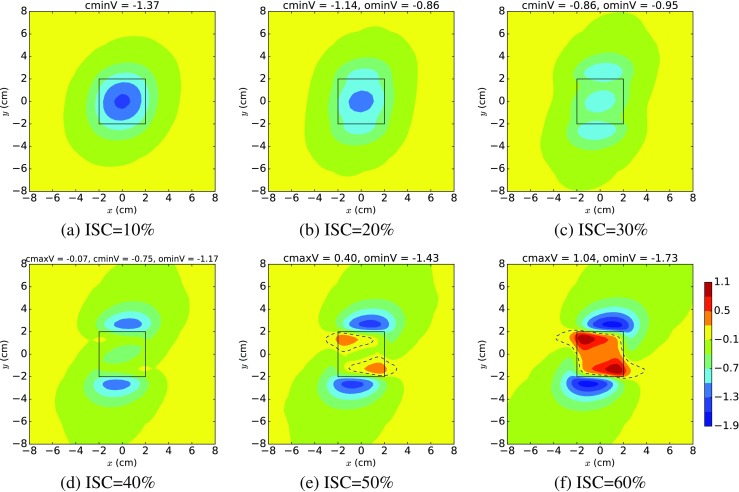
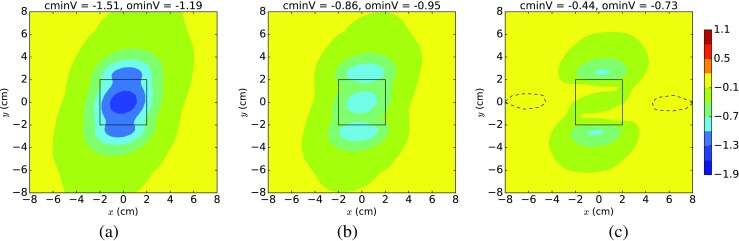
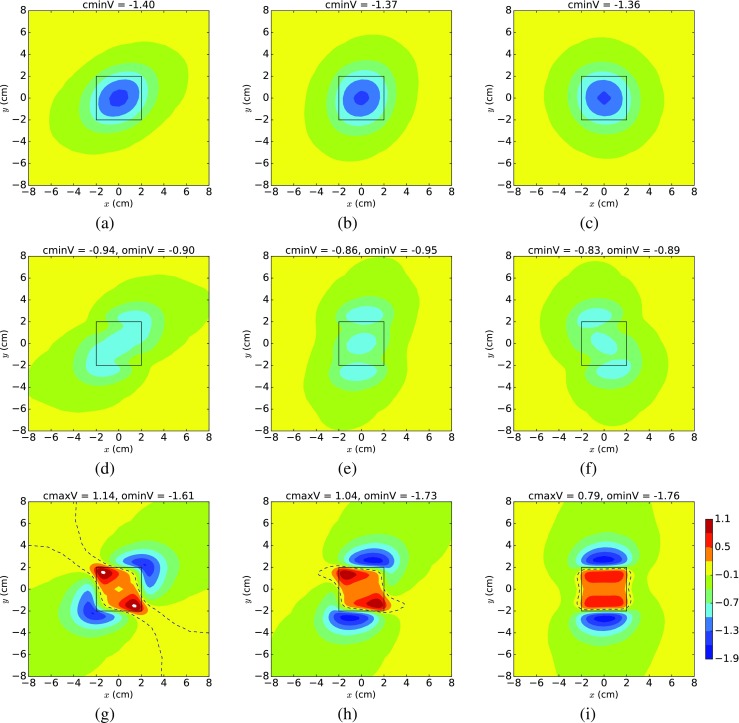
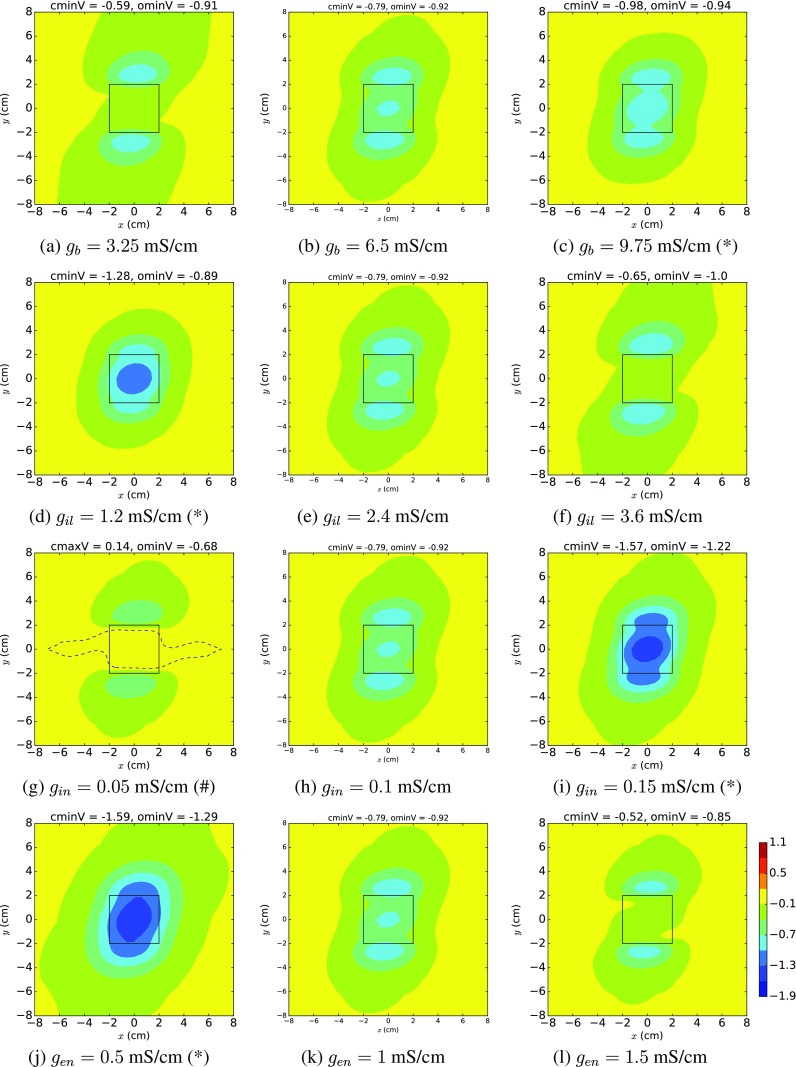
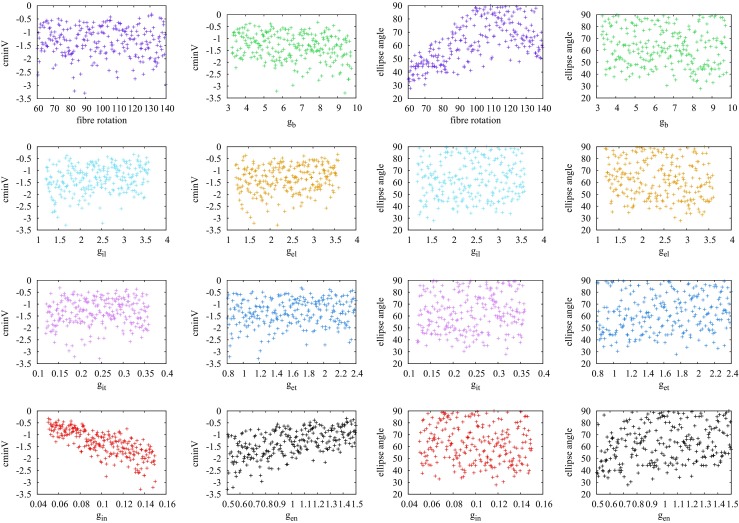
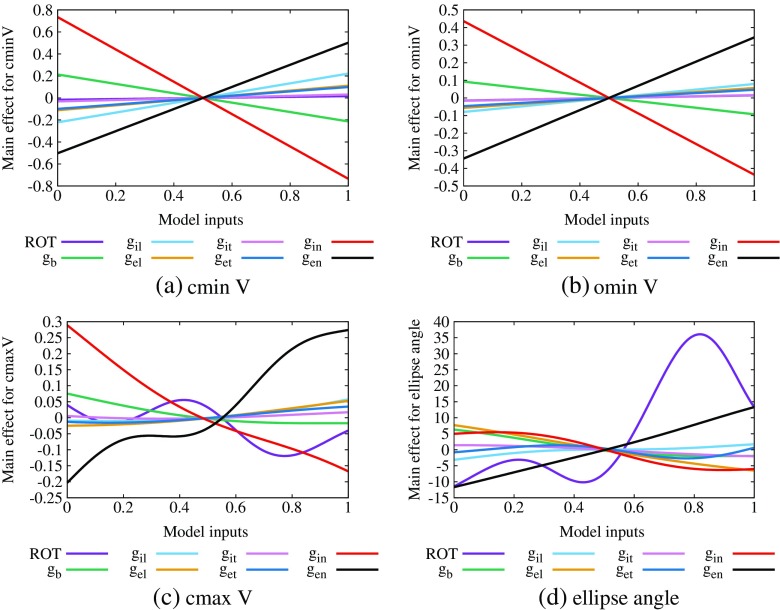
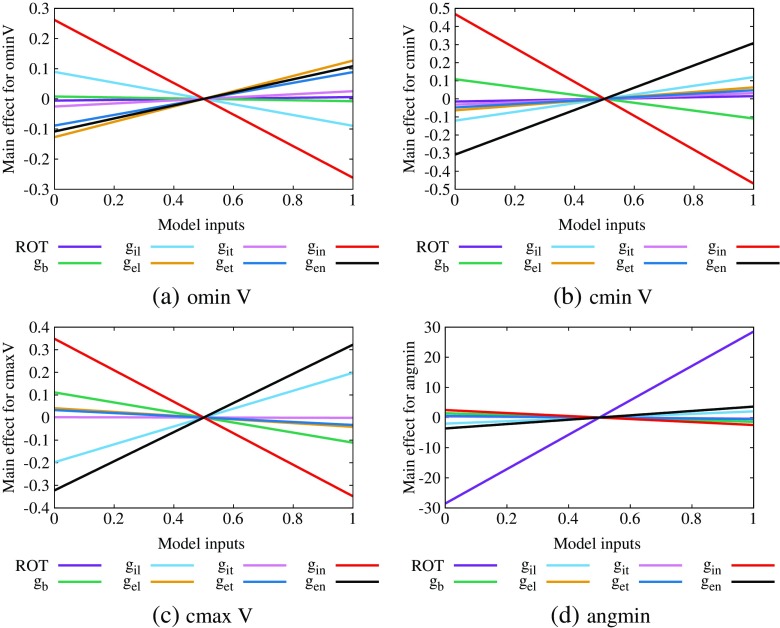
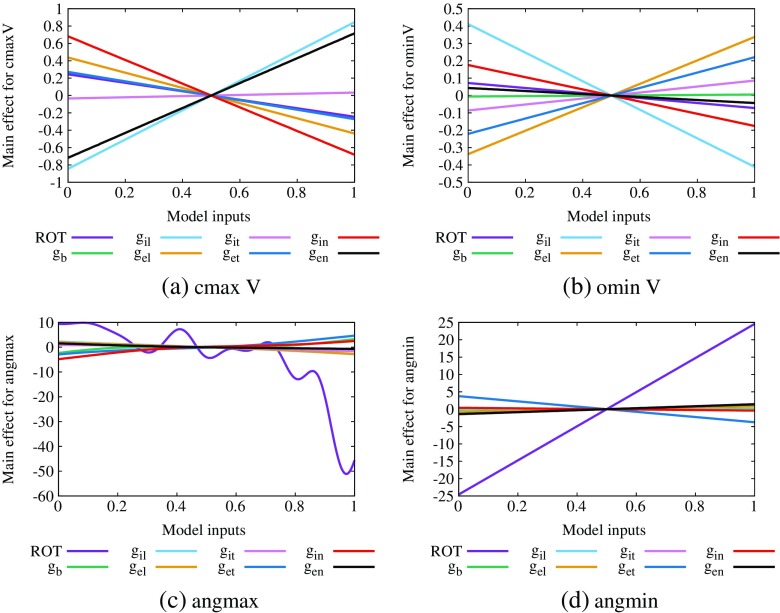
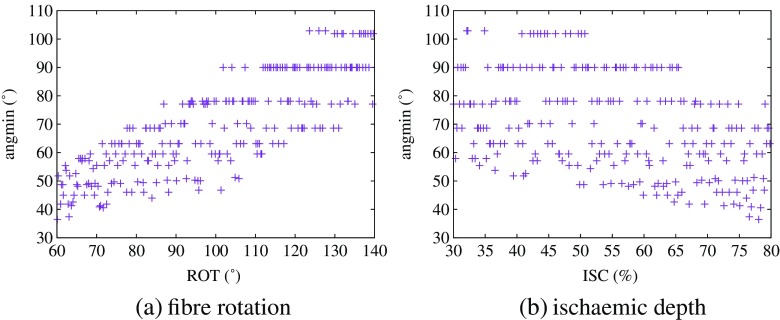
Reduced blood flow in the coronary arteries can lead to damaged heart tissue (myocardial ischaemia). Although one method for detecting myocardial ischaemia involves changes in the ST segment of the electrocardiogram, the relationship between these changes and subendocardial ischaemia is not fully understood. In this study, we modelled ST-segment epicardial potentials in a slab model of cardiac ventricular tissue, with a central ischaemic region, using the bidomain model, which considers conduction longitudinal, transverse and normal to the cardiac fibres. We systematically quantified the effect of uncertainty on the input parameters, fibre rotation angle, ischaemic depth, blood conductivity and six bidomain conductivities, on outputs that characterise the epicardial potential distribution. We found that three typical types of epicardial potential distributions (one minimum over the central ischaemic region, a tripole of minima, and two minima flanking a central maximum) could all occur for a wide range of ischaemic depths. In addition, the positions of the minima were affected by both the fibre rotation angle and the ischaemic depth, but not by changes in the conductivity values. We also showed that the magnitude of ST depression is affected only by changes in the longitudinal and normal conductivities, but not by the transverse conductivities.
Keywords: Bidomain model; Conductivity values; Gaussian process emulators; Ischaemia; ST depression.
Figures
Similar articles
-
Approaches for determining cardiac bidomain conductivity values: progress and challenges.Med Biol Eng Comput. 2020 Dec;58(12):2919-2935. doi: 10.1007/s11517-020-02272-z. Epub 2020 Oct 22. Med Biol Eng Comput. 2020. PMID: 33089458 Free PMC article. Review.
-
Determining the most significant input parameters in models of subendocardial ischaemia and their effect on ST segment epicardial potential distributions.Comput Biol Med. 2018 Apr 1;95:75-89. doi: 10.1016/j.compbiomed.2018.02.003. Epub 2018 Feb 10. Comput Biol Med. 2018. PMID: 29459293
-
Sensitivity analysis of ST-segment epicardial potentials arising from changes in ischaemic region conductivities in early and late stage ischaemia.Comput Biol Med. 2018 Nov 1;102:288-299. doi: 10.1016/j.compbiomed.2018.06.005. Epub 2018 Jun 15. Comput Biol Med. 2018. PMID: 29914695
-
Which bidomain conductivity is the most important for modelling heart and torso surface potentials during ischaemia?Comput Biol Med. 2021 Oct;137:104830. doi: 10.1016/j.compbiomed.2021.104830. Epub 2021 Sep 8. Comput Biol Med. 2021. PMID: 34534792
-
The effect of conductivity on ST-segment epicardial potentials arising from subendocardial ischemia.Ann Biomed Eng. 2005 Jun;33(6):751-63. doi: 10.1007/s10439-005-3236-2. Ann Biomed Eng. 2005. PMID: 16078615
Cited by
-
Extracellular Perinexal Separation Is a Principal Determinant of Cardiac Conduction.Circ Res. 2023 Sep 29;133(8):658-673. doi: 10.1161/CIRCRESAHA.123.322567. Epub 2023 Sep 8. Circ Res. 2023. PMID: 37681314 Free PMC article.
-
Deep learning-based reduced order models in cardiac electrophysiology.PLoS One. 2020 Oct 1;15(10):e0239416. doi: 10.1371/journal.pone.0239416. eCollection 2020. PLoS One. 2020. PMID: 33002014 Free PMC article.
-
Enabling forward uncertainty quantification and sensitivity analysis in cardiac electrophysiology by reduced order modeling and machine learning.Int J Numer Method Biomed Eng. 2021 Jun;37(6):e3450. doi: 10.1002/cnm.3450. Epub 2021 May 7. Int J Numer Method Biomed Eng. 2021. PMID: 33599106 Free PMC article.
-
Approaches for determining cardiac bidomain conductivity values: progress and challenges.Med Biol Eng Comput. 2020 Dec;58(12):2919-2935. doi: 10.1007/s11517-020-02272-z. Epub 2020 Oct 22. Med Biol Eng Comput. 2020. PMID: 33089458 Free PMC article. Review.
-
A modified approach to determine the six cardiac bidomain conductivities.Comput Biol Med. 2021 Aug;135:104549. doi: 10.1016/j.compbiomed.2021.104549. Epub 2021 Jun 9. Comput Biol Med. 2021. PMID: 34171640 Free PMC article.
References
-
- Abdi H (2003) Partial least squares regression (PLS-regression), pp 792–795. Encyclopedia for research methods for the social sciences. Sage
-
- Ayache N, Delingette H, Sermesant M (eds) (2009) A quantitative comparison of the myocardial fibre orientation in the rabbit as determined by histology and by diffusion tensor-MRI. Functional imaging and modeling of the heart: 5th international conference
-
- Barnes JP (2013) Mathematically modeling the electrophysiological effects of ischaemia in the heart. Ph.D. thesis, Griffith University, Brisbane, Australia
-
- Barnes JP, Johnston PR (2010) The effect of the shape of ischaemic regions in the heart on the resulting extracellular epicardial potential distributions. In: Murray A (ed) Computing in cardiology, vol 37. IEEE, IEEE Press, pp 177–180
MeSH terms
Grants and funding
LinkOut - more resources
Full Text Sources
Other Literature Sources
