Evaluation of Metabolic and Synaptic Dysfunction Hypotheses of Alzheimer's Disease (AD): A Meta-Analysis of CSF Markers
- PMID: 28933272
- PMCID: PMC5769087
- DOI: 10.2174/1567205014666170921122458
Evaluation of Metabolic and Synaptic Dysfunction Hypotheses of Alzheimer's Disease (AD): A Meta-Analysis of CSF Markers
Abstract
Background: Alzheimer's disease (AD) is currently incurable and a majority of investigational drugs have failed clinical trials. One explanation for this failure may be the invalidity of hypotheses focusing on amyloid to explain AD pathogenesis. Recently, hypotheses which are centered on synaptic and metabolic dysfunction are increasingly implicated in AD.
Objective: Evaluate AD hypotheses by comparing neurotransmitter and metabolite marker concentrations in normal versus AD CSF.
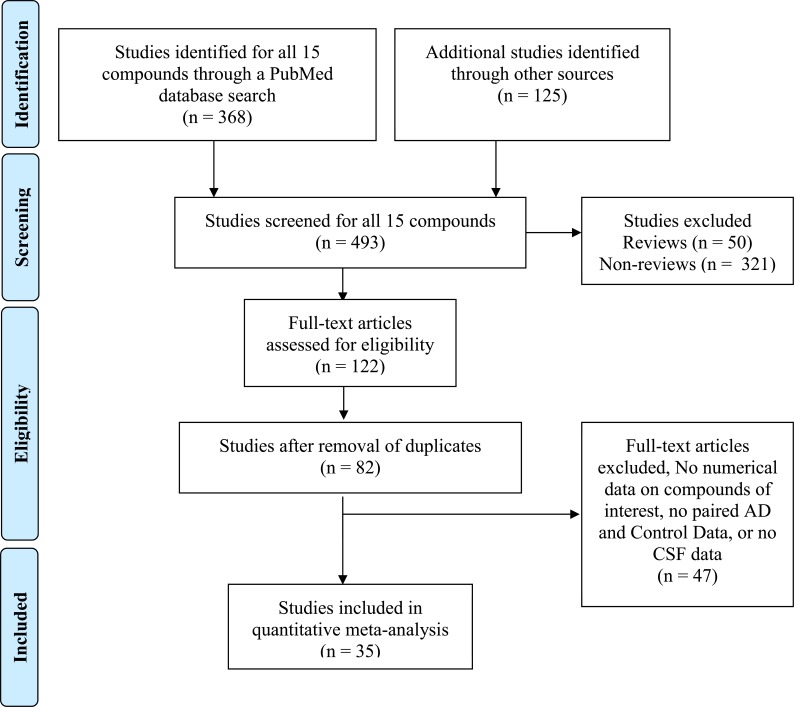
Methods: Meta-analysis allows for statistical comparison of pooled, existing cerebrospinal fluid (CSF) marker data extracted from multiple publications, to obtain a more reliable estimate of concentrations. This method also provides a unique opportunity to rapidly validate AD hypotheses using the resulting CSF concentration data. Hubmed, Pubmed and Google Scholar were comprehensively searched for published English articles, without date restrictions, for the keywords "AD", "CSF", and "human" plus markers selected for synaptic and metabolic pathways. Synaptic markers were acetylcholine, gamma-aminobutyric acid (GABA), glutamine, and glycine. Metabolic markers were glutathione, glucose, lactate, pyruvate, and 8 other amino acids. Only studies that measured markers in AD and controls (Ctl), provided means, standard errors/deviation, and subject numbers were included. Data were extracted by six authors and reviewed by two others for accuracy. Data were pooled using ratio of means (RoM of AD/Ctl) and random effects meta-analysis using Cochrane Collaboration's Review Manager software.
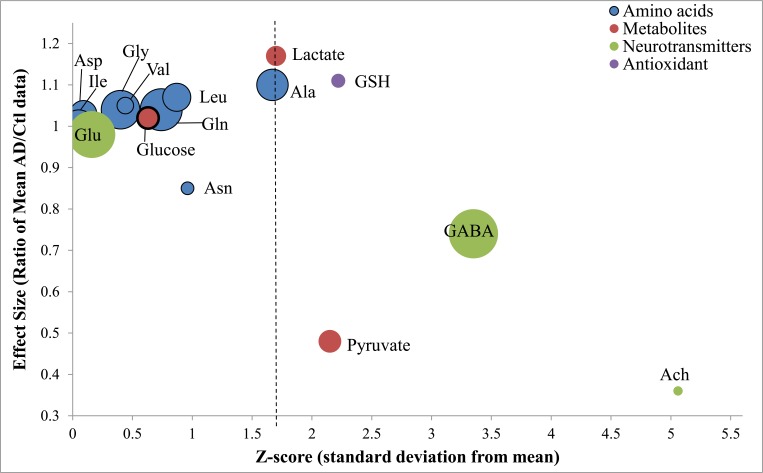
Results: Of the 435 identified publications, after exclusion and removal of duplicates, 35 articles were included comprising a total of 605 AD patients and 585 controls. The following markers of synaptic and metabolic pathways were significantly changed in AD/controls: acetylcholine (RoM 0.36, 95% CI 0.24-0.53, p<0.00001), GABA (0.74, 0.58-0.94, p<0.01), pyruvate (0.48, 0.24-0.94, p=0.03), glutathione (1.11, 1.01- 1.21, p=0.03), alanine (1.10, 0.98-1.23, p=0.09), and lower levels of significance for lactate (1.2, 1.00-1.47, p=0.05). Of note, CSF glucose and glutamate levels in AD were not significantly different than that of the controls.
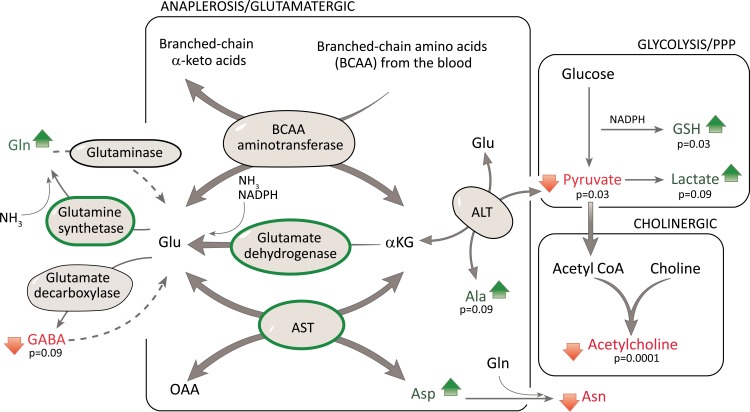
Conclusion: This study provides proof of concept for the use of meta-analysis validation of AD hypotheses, specifically via robust evidence for the cholinergic hypothesis of AD. Our data disagree with the other synaptic hypotheses of glutamate excitotoxicity and GABAergic resistance to neurodegeneration, given observed unchanged glutamate levels and decreased GABA levels. With regards to metabolic hypotheses, the data supported upregulation of anaerobic glycolysis, pentose phosphate pathway (glutathione), and anaplerosis of the tricarboxylic acid cycle using glutamate. Future applications of meta-analysis indicate the possibility of further in silico evaluation and generation of novel hypotheses in the AD field.
Keywords: Anaplerosis; CSF; GABA resistance; anaerobic glycolysis; cholinergic hypothesis; glutamate excitotoxicity; glutaminolysis; pentose phosphate pathway.
Copyright© Bentham Science Publishers; For any queries, please email at epub@benthamscience.org.
Figures
References
-
- Kennedy M.E., Stamford A.W., Chen X., Cox K., Cumming J.N., Dockendorf M.F., et al. The BACE1 inhibitor verubecestat (MK-8931) reduces CNS β-amyloid in animal models and in Alzheimer’s disease patients. Sci. Transl. Med. 2016;8(363):363ra150. - PubMed
-
- Geets H. Disconnect transgenic mice and CNS drug discovery. CNS Drugs. 2009;23:915–926. - PubMed
-
- Bartus R.T., Dean R.L., Beer B., Lippa A.S. Cholinergic hypothesis of geriatric memory dysfunction. Science. 1982;217:408–417. - PubMed
-
- Davis B.M., Mohs R.C., Greenwald M.D., Mathe A.A., Johns C.A., Horvath T.B., et al. Clinical studies of the cholinergic deficit in Alzheimer’s disease. J. Am. Geriatr. Soc. 1985;33:741–748. - PubMed
Publication types
MeSH terms
Substances
Grants and funding
LinkOut - more resources
Full Text Sources
Other Literature Sources
Medical