. 2018 Jan;39(1):24-34.
doi: 10.1038/aps.2017.126. Epub 2017 Sep 21.

Carnosine suppresses oxygen-glucose deprivation/recovery-induced proliferation and migration of reactive astrocytes of rats in vitro

Affiliations

Carnosine suppresses oxygen-glucose deprivation/recovery-induced proliferation and migration of reactive astrocytes of rats in vitro

Li Ou-Yang et al. Acta Pharmacol Sin. 2018 Jan.

Abstract

Glial scar formation resulted from excessive astrogliosis limits axonal regeneration and impairs recovery of function, thus an intervention to ameliorate excessive astrogliosis is crucial for the recovery of neurological function after cerebral ischemia. In this study we investigated the effects of carnosine, an endogenous water-soluble dipeptide (β-alanyl-L-histidine), on astrogliosis of cells exposed to oxygen-glucose deprivation/recovery (OGD/R) in vitro. Primary cultured rat astrocytes exhibited a significant increase in proliferation at 24 h recovery after OGD for 2 h. Pretreatment with carnosine (5 mmol/L) caused G1 arrest of reactive astrocytes, significantly attenuated OGD/R-induced increase in cyclin D1 protein expression and suppressed OGD/R-induced proliferation of reactive astrocytes. Carnosine treatment also reversed glycolysis and ATP production, which was elevated at 24 h recovery after OGD. A marked increase in migration of reactive astrocytes was observed at 24 h after OGD, whereas carnosine treatment reversed the expression levels of MMP-9 and suppressed the migration of astrocytes. Furthermore, carnosine also improved neurite growth of cortical neurons co-cultured with astrocytes under ischemic conditions. These results demonstrate that carnosine may be a promising candidate for inhibiting astrogliosis and promoting neurological function recovery after ischemic stroke.


Figures

Figure 1
Figure 1
Effect of OGD and recovery times on the proliferation of cultured astrocytes. Astrocytes were exposed to OGD for 2 or 4 h followed by recovery for 24, 48 or 72 h. Total LDH content was assayed after OGD for 2 or 4 h followed by recovery for 24 h (A) or after OGD for 2 h followed by recovery for 24, 48 or 72 h (B). The percentage of BrdU-positive cells was statistically analyzed after OGD for 2 or 4 h followed by recovery for 24 h (C) or after OGD for 2 h followed by recovery for 24, 48 or 72 h (D). Immunohistochemistry for GFAP expression in cultured astrocytes exposed to OGD for 2 h and recovery for 24 h (E). (F, G) Western blot of GFAP expression in cultured astrocytes exposed to OGD for 2 h and recovery for 24 h. Data represent the mean±SD. **P<0.01 vs control group. Scale bar, 100 μm.
Figure 2
Figure 2
Carnosine suppressed reactive gliosis of astrocytes induced by OGD/R. Astrocytes were pre-treated with carnosine (1 or 5 mmol/L) for 30 min and were then exposed to OGD for 2 h and recovery for 24 h. At the end of OGD/R, the total LDH content was assayed (A), and double immunofluorescence of BrdU (red) and DAPI (blue) in astrocytes was performed. Proportions of proliferation cells in each group after OGD/R were statistically analyzed (B, C). GFAP protein levels were also analyzed by Western blot after OGD/R (D). Densitometric analysis of bands for relative GFAP protein expression levels is shown (E). Extracellular IL-1β level was measured by ELISA (F). Data represent the mean±SD. **P<0.01 vs control group. &P<0.05, ##P<0.01 vs OGD/R group. Scale bar, 200 μm.
Figure 3
Figure 3
Carnosine inhibited cell cycle progression in cultured astrocytes exposed to OGD/R. Representative pictures of flow cytometric analysis of control, OGD/R, and carnosine-treated cells (A). Statistical analysis of the percentage of cells in each cell cycle phase (B). Western blot analysis of the expression level of cyclin D1 in astrocytes exposed to OGD/R and carnosine treatment (C). Densitometric analysis of bands for relative cyclin D1 protein expression level (D). Data represent the mean±SD. *P<0.05 vs control group. #P<0.05 vs OGD/R group.
Figure 4
Figure 4
Effect of carnosine on astrocytic energy metabolism in cultured astrocytes exposed to OGD/R. Real-time analysis of OCRs (A) and ECARs (B) of cultured astrocytes exposed to OGD/R and carnosine treatment by perturbing them with small molecule metabolic modulators. Oligomycin (O, 1 μg/mL), FCCP (F, 1 μmol/L), and rotenone (R, 1 μmol/L) were injected sequentially at the indicated time points into each well containing astrocytes after baseline rate measurement. Multiple mitochondrial function parameters, including basal OCRs, ATP-linked OCRs, proton leak, mitochondrial respiration and non-mitochondrial respiration OCRs, are shown (C). OCRs and ECARs were normalized to total protein/well after completion of the assay. Carnosine treatment decreased the cellular ATP level in astrocytes exposed to OGD/R (E). Intracellular ATP level was measured at the end of OGD/R. Data represent the mean±SD. *P<0.05, **P<0.01 vs control group. ##P<0.01 vs OGD/R group.
Figure 5
Figure 5
Carnosine inhibited astrocyte migration after OGD/R. Photomicrographs of DAPI-stained astrocytes that crossed the filters with 8-μm pore size (A). Statistical analysis of relative migration rates of astrocytes in the control, OGD/R and carnosine-treated groups (B). Western blot analysis of the expression level of MMP-9 protein in astrocytes exposed to OGD/R and carnosine treatment (C). Densitometric analysis of bands for relative MMP-9 protein expression level (D). Data represent the mean±SD. *P<0.05, **P<0.01 vs control group. &&P<0.01 vs OGD/R group.
Figure 6
Figure 6
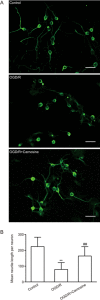
Carnosine increased neurite length in astrocyte/neuron co-cultures exposed to OGD/R. Beta III tubulin immunostaining of co-cultured neurons (A). Scale bar, 200 μm. Quantification of mean neurite length per neuron (B). Data represent the mean±SD. **P<0.01 vs control group. ##P<0.01 vs OGD/R group.

References

    1. Huang L, Wu ZB, Zhuge Q, Zheng W, Shao B, Wang B, et al. Glial scar formation occurs in the human brain after ischemic stroke. Int J Med Sci 2014; 11: 344–8. - PMC - PubMed
    1. Cregg JM, DePaul MA, Filous AR, Lang BT, Tran A, Silver J. Functional regeneration beyond the glial scar. Exp Neurol 2014; 253: 197–207. - PMC - PubMed
    1. Yiu G, He Z. Glial inhibition of CNS axon regeneration. Nat Rev Neurosci 2006; 7: 617–27. - PMC - PubMed
    1. Raposo C, Schwartz M. Glial scar and immune cell involvement in tissue remodeling and repair following acute CNS injuries. Glia 2014; 62: 1895–904. - PubMed
    1. Tan AM, Zhang W, Levine JM. NG2: a component of the glial scar that inhibits axon growth. J Anat 2005; 207: 717–25. - PMC - PubMed