. 2017 Jul 26;22(8):1212.
doi: 10.3390/molecules22081212.

Structure and Catalysis of Fe(III) and Cu(II) Microperoxidase-11 Interacting with the Positively Charged Interfaces of Lipids

Affiliations

Structure and Catalysis of Fe(III) and Cu(II) Microperoxidase-11 Interacting with the Positively Charged Interfaces of Lipids

Tatiana Prieto et al. Molecules. .

Abstract

Numerous applications have been described for microperoxidases (MPs) such as in photoreceptors, sensing, drugs, and hydrogen evolution. The last application was obtained by replacing Fe(III), the native central metal, by cobalt ion and inspired part of the present study. Here, the Fe(III) of MP-11 was replaced by Cu(II) that is also a stable redox state in aerated medium, and the structure and activity of both MPs were modulated by the interaction with the positively charged interfaces of lipids. Comparative spectroscopic characterization of Fe(III) and Cu(II)MP-11 in the studied media demonstrated the presence of high and low spin species with axial distortion. The association of the Fe(III)MP-11 with CTAB and Cu(II)MP-11 with DODAB affected the colloidal stability of the surfactants that was recovered by heating. This result is consistent with hydrophobic interactions of MPs with DODAB vesicles and CTAB micelles. The hydrophobic interactions decreased the heme accessibility to substrates and the Fe(III) MP-11catalytic efficiency. Cu(II)MP-11 challenged by peroxides exhibited a cyclic Cu(II)/Cu(I) interconversion mechanism that is suggestive of a mimetic Cu/ZnSOD (superoxide dismutase) activity against peroxides. Hydrogen peroxide-activated Cu(II)MP-11 converted Amplex Red® to dihydroresofurin. This study opens more possibilities for technological applications of MPs.

Keywords: CTAB micelles; DODAB large vesicles; EPR; MCD; microperoxidase-11.


Conflict of interest statement

The authors declare no conflict of interest. The founding sponsors had no role in the design of the study; in the collection, analyses, or interpretation of data; in the writing of the manuscript, and in the decision to publish the results.

Figures

Figure 1
Figure 1
Cartoon of the microperoxidase structure. The upper side of the figure shows the MP-11 structure with the histidine side chain (blue) as a fifth axial ligand and the thioether bonds with cysteine residues (yellow) highlighted. The lower side of the figure represents the formation of Compound 0 by the replacement of water (OH) by a hydrogen peroxide molecule (HO-O) at the sixth axial position of heme iron. The microperoxidase structure was generated in the PyMol, 4.3 software by hiding part of Fe(III) horse heart cytochrome c structure available in Protein Data Bank (1HRC). Water and hydrogen peroxide molecules were designed using 3D representation in ChemSketch 2016.1 (free version for educational use only).
Figure 2
Figure 2
Snapshot of MP-11 solutions in homogeneous and heterogeneous media. Left and center panels show, respectively solutions of Fe(III) and Cu(II)MP-11. In each panel, each cuvette shows, respectively, MP-11 in HEPES-buffered aqueous solution, CTAB micelles, and DODAB liposomes at room temperature. Right panel shows, from left to right, the cuvettes containing, respectively Cu(II)MP-11 in DODAB and Fe(III)MP-11 in CTAB, after heating at 70 °C. The heating solubilized the aggregates that were shown in the left and center panels. Below the snapshots of cuvettes, the drawings represent possible MP-11/lipid structure interactions that are present in the flocculated systems at room temperature and the solubilized systems after heating. The drawings are not in scale.
Figure 3
Figure 3
Comparative UV-visible spectra of Fe(III) or Cu(II)MP-11 in homogeneous and heterogeneous media. (A) The homogeneous medium is 5 mM HEPES buffer at pH 7.4. The heterogeneous medium is a suspension of (B) HEPES buffered 20 mM CTAB micelles and (C) HEPES buffered 2 mM DODAB LUVs. The spectra of 20 µM Fe(III) (black line) and Cu(II) (red line) MP-11 were recorded using a 0.1 cm quartz cuvette at 25 °C. For the systems with low colloidal stability, a 30 min of heating preceded the spectral analysis. The principal λmax values are indicated in the spectra.
Figure 4
Figure 4
Comparative CD and MCD spectra of Fe(III) and Cu(II)MP-11 in homogeneous and heterogeneous media. (A) HEPES buffer. Left panel corresponds to positive and negative λmax at increased values of the external magnetic field (from 0.005 to 0.9965 T). Black and red symbols correspond to (Fe(III) and Cu(II), respectively. Right panels, depicted the CD spectra (dotted lines) of Fe(III) (black lines) and Cu(II)MP-11 (red lines) superimposed by the corresponding MCD spectra (solid lines); (B) CTAB micelles. Left panel corresponds to positive and negative λmax at increased values of the external magnetic field (from 0.005 to 0.9965 T). Black and red symbols correspond to (Fe(III) and Cu(II), respectively. Right panels, depict the CD spectra (dotted lines) of Fe(III) (black lines) and Cu(II)MP-11 (red lines) superimposed by the corresponding MCD spectra (solid lines) and (C) DODAB LUVs. Upper and lower panels show the CD spectra (dotted lines) of Fe(III) (black lines) and Cu(II)MP-11 (red lines) superimposed by the corresponding MCD spectra (solid lines). In the upper panel of C, the inset shows a non-typical equally intense band obtained at positive (gray line) and negative (black line) magnetic fields. The spectra were recorded with 20 µM MP-11 using a 0.1 cm quartz cuvette at 25 °C.
Figure 4
Figure 4
Comparative CD and MCD spectra of Fe(III) and Cu(II)MP-11 in homogeneous and heterogeneous media. (A) HEPES buffer. Left panel corresponds to positive and negative λmax at increased values of the external magnetic field (from 0.005 to 0.9965 T). Black and red symbols correspond to (Fe(III) and Cu(II), respectively. Right panels, depicted the CD spectra (dotted lines) of Fe(III) (black lines) and Cu(II)MP-11 (red lines) superimposed by the corresponding MCD spectra (solid lines); (B) CTAB micelles. Left panel corresponds to positive and negative λmax at increased values of the external magnetic field (from 0.005 to 0.9965 T). Black and red symbols correspond to (Fe(III) and Cu(II), respectively. Right panels, depict the CD spectra (dotted lines) of Fe(III) (black lines) and Cu(II)MP-11 (red lines) superimposed by the corresponding MCD spectra (solid lines) and (C) DODAB LUVs. Upper and lower panels show the CD spectra (dotted lines) of Fe(III) (black lines) and Cu(II)MP-11 (red lines) superimposed by the corresponding MCD spectra (solid lines). In the upper panel of C, the inset shows a non-typical equally intense band obtained at positive (gray line) and negative (black line) magnetic fields. The spectra were recorded with 20 µM MP-11 using a 0.1 cm quartz cuvette at 25 °C.
Figure 5
Figure 5
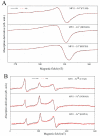
Experimental and simulated EPR spectra of MP-11 with Fe(III) (A) and Cu(II) (B) as the central metals in HEPES, CTAB, and DODAB, as indicated and obtained with frozen solutions of same concentrations. The EPR parameters used are shown in Table 2.
Figure 6
Figure 6
FTIR spectra of Cu(II) (black line) and Fe(III)MP-11 (gray line) and the spectral regions where the vibrational bands of Cu(II) complexed with carbonyl groups of Ala, Gln, His and Lys and the region of Val complexed with Cu(II) are expected.
Figure 7
Figure 7
Kinetic study of the reaction of Fe(III)MP-11 and HRP with Amplex Red® as a function of hydrogen peroxide concentration. (A) Representative curves of resofurin production during the Amplex Red® oxidation by Fe(III)MP-11 associated with CTAB micelles, using 2, 5 and 10 µM of hydrogen peroxide; (B) Fe(III)MP-11 and (C) HRP Lineweaver-Burk plots of the reciprocal kobs values obtained by fitting the curves of temporal generation of resofurin vs. the reciprocal of the hydrogen peroxide concentration. The inset of panel A shows the structures of Amplex Red® and resofurin. Experimental conditions were: 100 nM Fe(III)MP-11 or 25 nM HRP, hydrogen peroxide concentrations were used in the range of 2–20 µM and 40 µM Amplex Red® buffered by HEPES. The reactions were carried out in a homogeneous medium (solid squares), 20 mM CTAB (solid circles) and 2 mM DODAB (open circles).
Figure 8
Figure 8
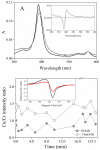
Cu(II)MP-11 peroxidase activity. (A) Time-resolved UV-visible spectra of 1 µM Cu(II)MP-11 during the reaction with 0.8 mM HOOH at 5 mM HEPES buffer solution, pH 7.4. The decreasing intensity spectra correspond to zero, 12 (light gray line) and 15 min (gray line) after hydrogen peroxide addition. The inset corresponds to the differential spectra obtained by subtracting the initial time from the spectra obtained after 12 min (light gray line) and 15 min (gray line) of the reaction; (B) EPR from Cu(II)MP-11 peroxidase activity using Cr(III) as a signal marker. The reactions were done in the presence of HOOH (gray circle) or t-BuOOH (open circle). The inset shows the first spectra (time zero) and after 70 min of t-BuOOH addition. Experimental conditions: 0.1 mM Cu(II)MP-11, 0.3 mM of peroxides, water buffered solution, gain 50 dB, modulation amplitude 1 mT, power microwave 2.5 mW, frequency microwave 9.48 GHz, the time constant 20 ms, conversion time 81.92 s, temperature 10 K.
Figure 9
Figure 9
Reaction of the hydrogen peroxide-activated Cu(II)MP-11 with Amplex Red. Time scan in the time range of 0–75 min of 0.5 µM Cu(II)MP-11 after addition of 40 µM Amplex Red and hydrogen peroxide, as indicated by the arrow. The inset shows the spectra of: (a) 0.5 µM Cu(II)MP-11; (b) Resofurin produced by 25 nM HRP activated by 40 µM hydrogen peroxide; (c) Leucoresofurin produced by resofurin reduction by superoxide ion generated by xanthine/xanthine oxidase system in the presence of 25 nM catalase used to eliminate hydrogen peroxide produced by spontaneous ion superoxide dismutation; (d) Cu(II)MP-11 added to leucoresofurin solution; (e) the same conditions of (d) reoxygenation after agitation. Another inset shows the structural representation of dihydroresofurin in a putative coordination with Cu(II) in the porphyrin ring. Only nitrogen atoms of the porphyrin ring were represented for clarity. In the 3D structure, carbons are cyan, nitrogens are blue, copper is yellow and oxygen is red. MP-11 histidine residue was represented at the fifth coordination position of cupper ion. Xanthine concentration was 400 µM and xanthine oxidase 0.6 U/mL.
Figure 10
Figure 10
Cartoon of putative interactions of HRP and MP-11 with CTAB micelles and DODAB vesicles. HRP and cytochrome c structures were generated in PyMol 4.3software, using the respective data for 1H58 and 1HRC that are available in Protein Data Bank. The MP-11 structure was highlighted in blue in the structure of cytochrome c (transparent gray). The structure of HRP (green) has the acidic amino acid residues that are responsible for the affinity to the positively charged interfaces highlighted in light cyan.

Similar articles

References

    1. Aron J., Baldwin D.A., Marques H.M., Pratt J.M., Adams P.A. Hemes and hemoproteins. J. Inorg. Biochem. 1986;27:227–243. doi: 10.1016/0162-0134(86)80064-2. - DOI - PubMed
    1. Wang T., Liu J., Ren J., Wang J., Wang E. Mimetic biomembrane—AuNPs—Graphene hybrid as matrix for enzyme immobilization and bioelectrocatalysis study. Talanta. 2015;143:438–441. doi: 10.1016/j.talanta.2015.05.022. - DOI - PubMed
    1. Kleingardner E.C., Asher W.B., Bren K.L. Efficient and Flexible Preparation of Biosynthetic Microperoxidases. Biochemistry. 2017;56:143–148. doi: 10.1021/acs.biochem.6b00915. - DOI - PubMed
    1. Braun M., Thöny-Meyer L. Biosynthesis of artificial microperoxidases by exploiting the secretion and cytochrome c maturation apparatuses of Escherichia coli. Proc. Natl. Acad. Soc. USA. 2004;101:12830–12835. doi: 10.1073/pnas.0402435101. - DOI - PMC - PubMed
    1. Munro O.Q., Marques H.M. Heme−Peptide Models for Hemoproteins. 1. Solution Chemistry of N-Acetylmicroperoxidase-8. Inorg. Chem. 1996;35:3752–3767. doi: 10.1021/ic9502842. - DOI - PubMed

LinkOut - more resources