

The Mechanisms for Within-Host Influenza Virus Control Affect Model-Based Assessment and Prediction of Antiviral Treatment
- PMID: 28933757
- PMCID: PMC5580454
- DOI: 10.3390/v9080197
The Mechanisms for Within-Host Influenza Virus Control Affect Model-Based Assessment and Prediction of Antiviral Treatment
Abstract
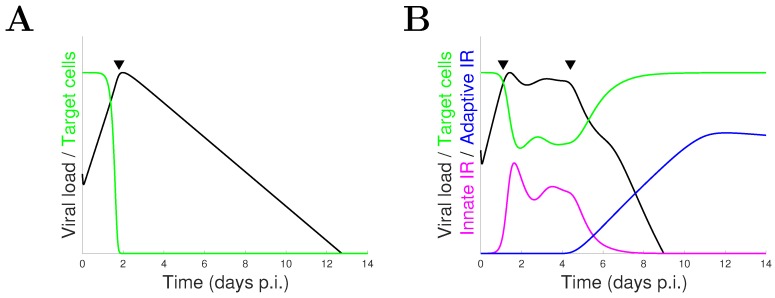
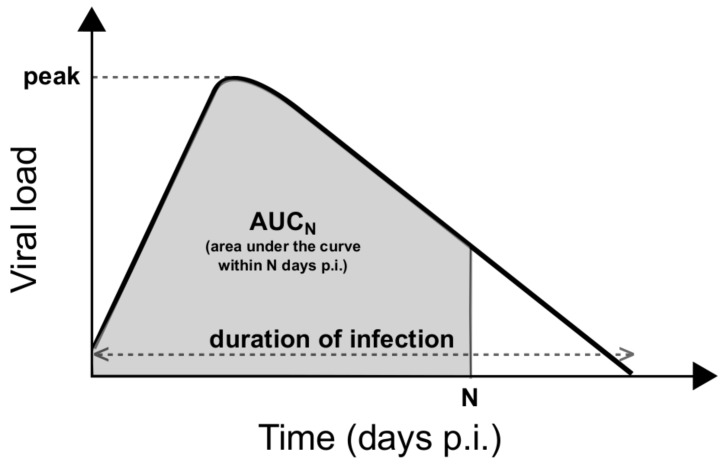
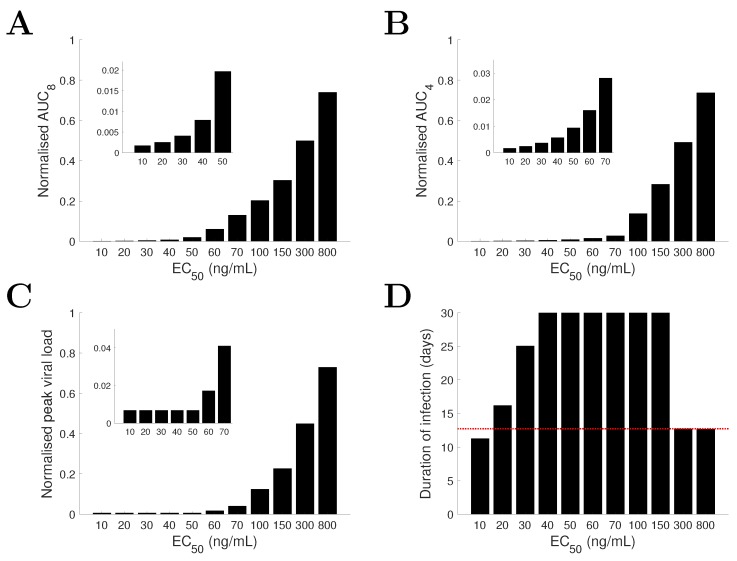
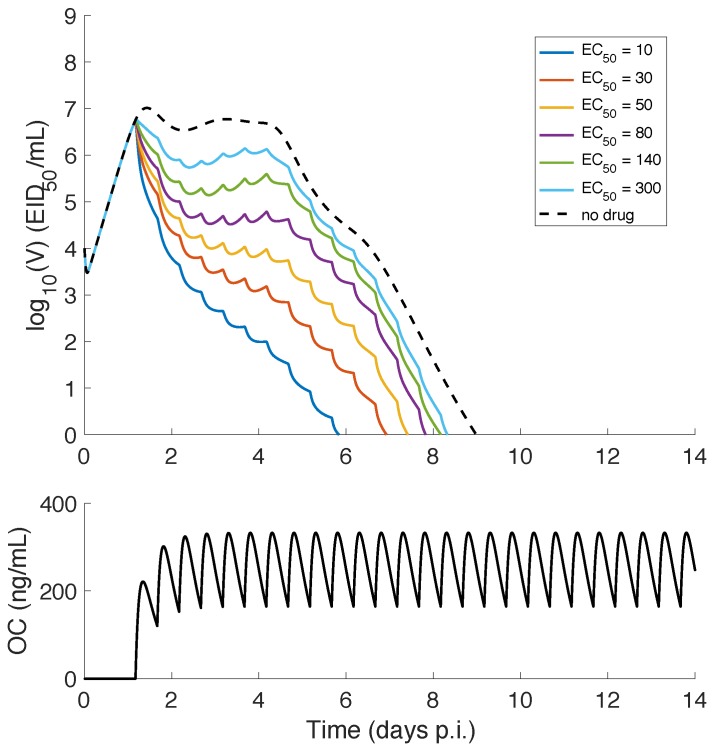
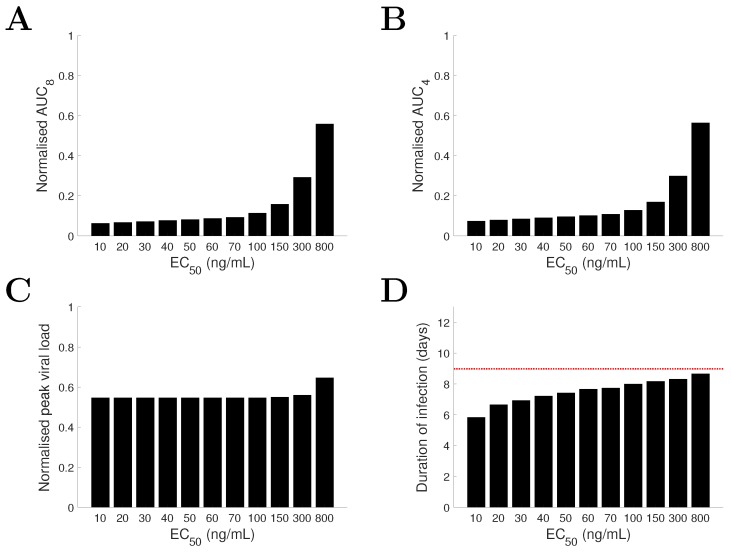
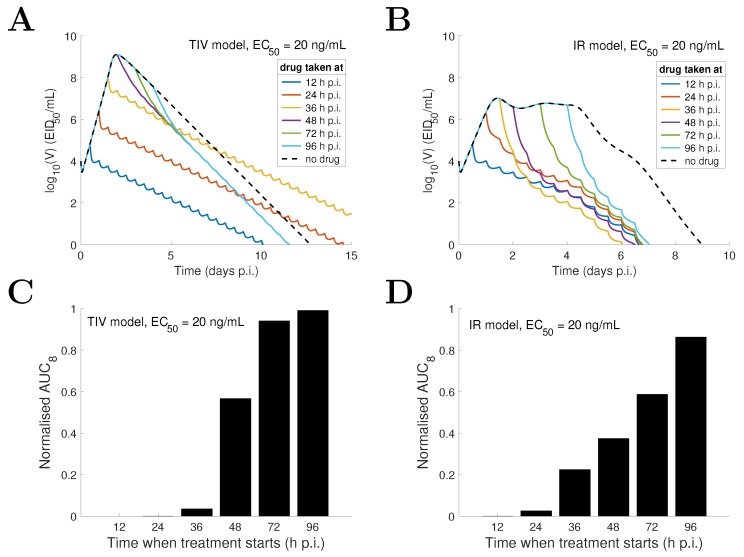
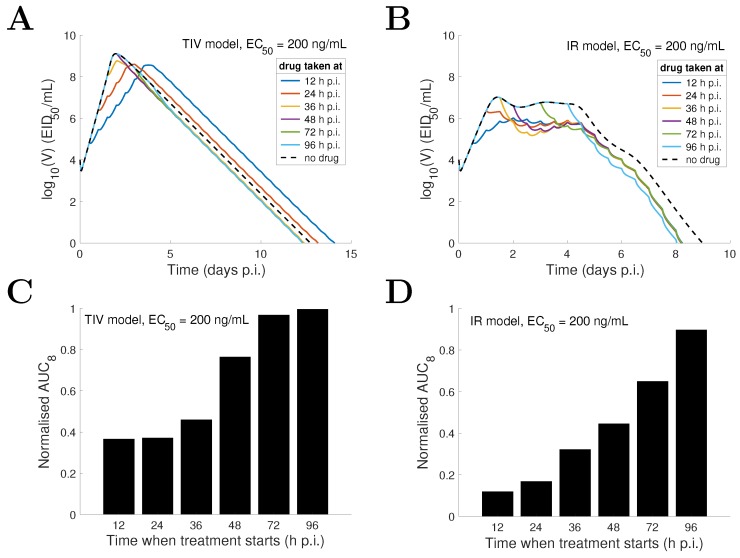
Models of within-host influenza viral dynamics have contributed to an improved understanding of viral dynamics and antiviral effects over the past decade. Existing models can be classified into two broad types based on the mechanism of viral control: models utilising target cell depletion to limit the progress of infection and models which rely on timely activation of innate and adaptive immune responses to control the infection. In this paper, we compare how two exemplar models based on these different mechanisms behave and investigate how the mechanistic difference affects the assessment and prediction of antiviral treatment. We find that the assumed mechanism for viral control strongly influences the predicted outcomes of treatment. Furthermore, we observe that for the target cell-limited model the assumed drug efficacy strongly influences the predicted treatment outcomes. The area under the viral load curve is identified as the most reliable predictor of drug efficacy, and is robust to model selection. Moreover, with support from previous clinical studies, we suggest that the target cell-limited model is more suitable for modelling in vitro assays or infection in some immunocompromised/immunosuppressed patients while the immune response model is preferred for predicting the infection/antiviral effect in immunocompetent animals/patients.
Keywords: drug efficacy; immune response; model selection; neuraminidase inhibitor; target cell depletion.
Conflict of interest statement
The authors declare no conflict of interest. The founding sponsors had no role in the design of the study; in the collection, analyses, or interpretation of data; in the writing of the manuscript, and in the decision to publish the results.
Figures
Similar articles
-
Modelling the Effect of MUC1 on Influenza Virus Infection Kinetics and Macrophage Dynamics.Viruses. 2021 May 7;13(5):850. doi: 10.3390/v13050850. Viruses. 2021. PMID: 34066999 Free PMC article.
-
Baloxavir marboxil, a novel cap-dependent endonuclease inhibitor potently suppresses influenza virus replication and represents therapeutic effects in both immunocompetent and immunocompromised mouse models.PLoS One. 2019 May 20;14(5):e0217307. doi: 10.1371/journal.pone.0217307. eCollection 2019. PLoS One. 2019. PMID: 31107922 Free PMC article.
-
Innate Immunity and the Inter-exposure Interval Determine the Dynamics of Secondary Influenza Virus Infection and Explain Observed Viral Hierarchies.PLoS Comput Biol. 2015 Aug 18;11(8):e1004334. doi: 10.1371/journal.pcbi.1004334. eCollection 2015 Aug. PLoS Comput Biol. 2015. PMID: 26284917 Free PMC article.
-
The Role of Type I IFNs in Influenza: Antiviral Superheroes or Immunopathogenic Villains?J Innate Immun. 2020;12(6):437-447. doi: 10.1159/000508379. Epub 2020 Jun 19. J Innate Immun. 2020. PMID: 32564033 Free PMC article. Review.
-
Response Modifiers: Tweaking the Immune Response Against Influenza A Virus.Front Immunol. 2019 Apr 12;10:809. doi: 10.3389/fimmu.2019.00809. eCollection 2019. Front Immunol. 2019. PMID: 31031778 Free PMC article. Review.
Cited by
-
Dynamical characterization of antiviral effects in COVID-19.Annu Rev Control. 2021;52:587-601. doi: 10.1016/j.arcontrol.2021.05.001. Epub 2021 May 28. Annu Rev Control. 2021. PMID: 34093069 Free PMC article.
-
Structure and Hierarchy of Influenza Virus Models Revealed by Reaction Network Analysis.Viruses. 2019 May 16;11(5):449. doi: 10.3390/v11050449. Viruses. 2019. PMID: 31100972 Free PMC article.
-
The rate of viral transfer between upper and lower respiratory tracts determines RSV illness duration.J Math Biol. 2019 Jul;79(2):467-483. doi: 10.1007/s00285-019-01364-1. Epub 2019 Apr 22. J Math Biol. 2019. PMID: 31011792
-
Antibody dynamics in Japanese paediatric patients with influenza A infection treated with neuraminidase inhibitors in a randomised trial.Sci Rep. 2019 Aug 15;9(1):11891. doi: 10.1038/s41598-019-47884-0. Sci Rep. 2019. PMID: 31417163 Free PMC article. Clinical Trial.
-
Modelling the Effect of MUC1 on Influenza Virus Infection Kinetics and Macrophage Dynamics.Viruses. 2021 May 7;13(5):850. doi: 10.3390/v13050850. Viruses. 2021. PMID: 34066999 Free PMC article.
References
Publication types
MeSH terms
Substances
LinkOut - more resources
Full Text Sources
Other Literature Sources
Medical
Miscellaneous
