

Effects of Land Use/Cover Changes and Urban Forest Configuration on Urban Heat Islands in a Loess Hilly Region: Case Study Based on Yan'an City, China
- PMID: 28933770
- PMCID: PMC5580544
- DOI: 10.3390/ijerph14080840
Effects of Land Use/Cover Changes and Urban Forest Configuration on Urban Heat Islands in a Loess Hilly Region: Case Study Based on Yan'an City, China
Abstract
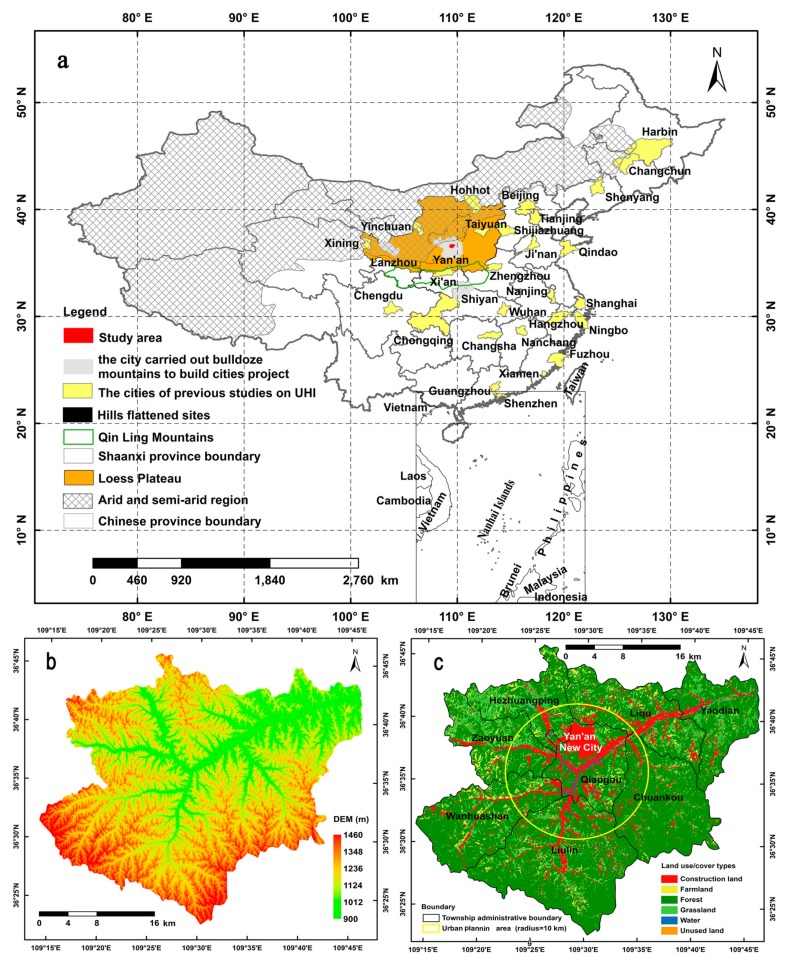
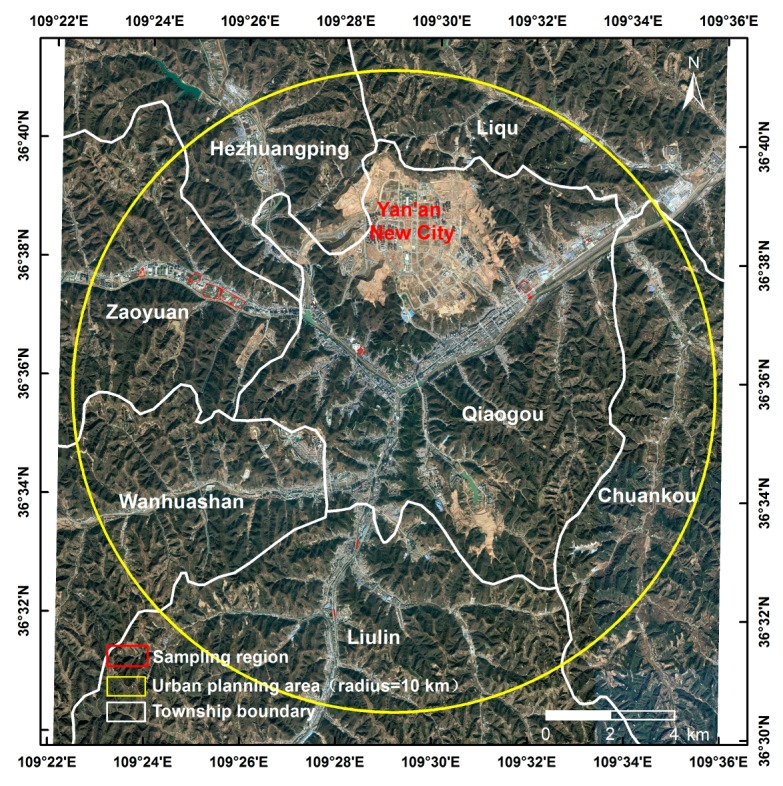
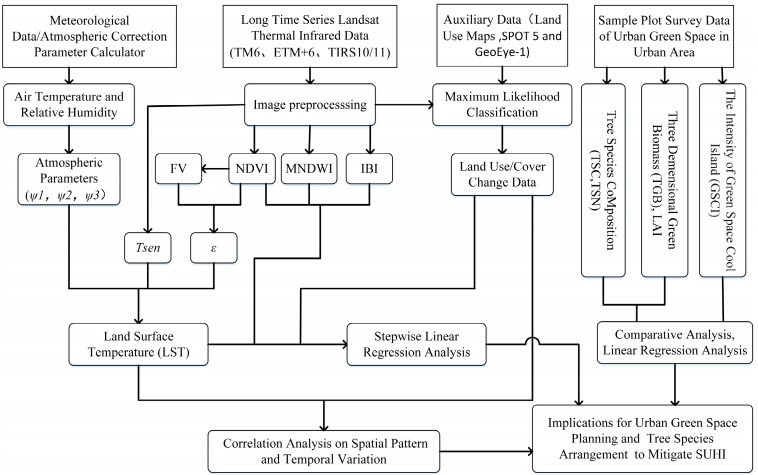
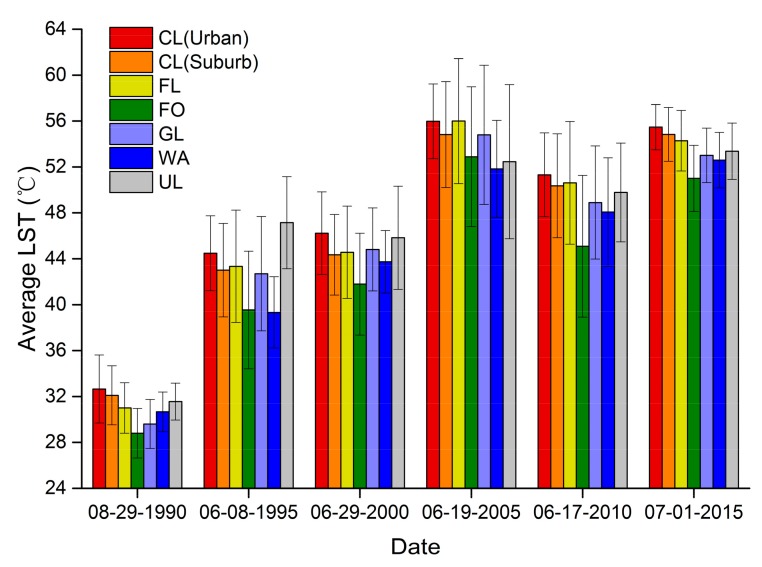
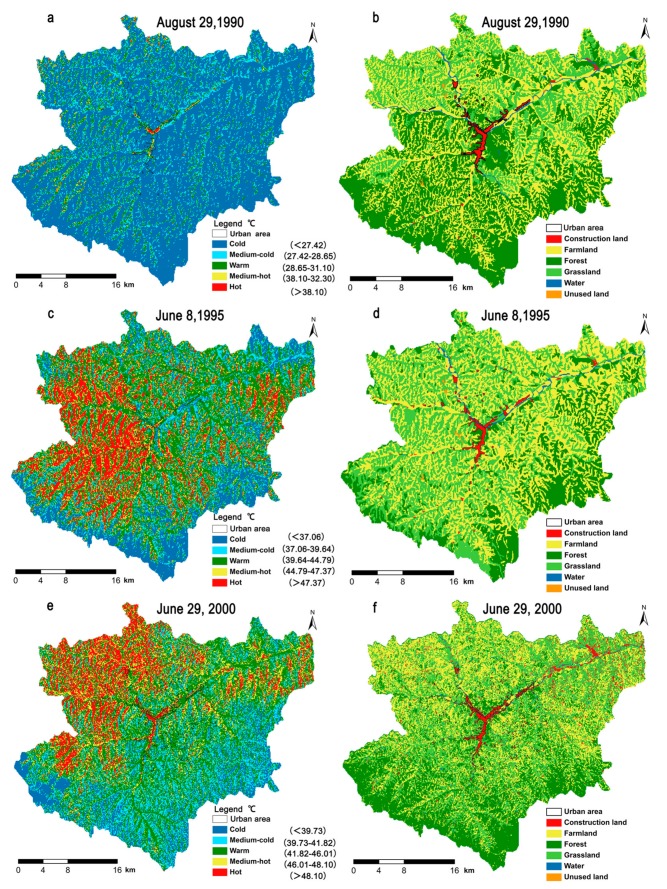
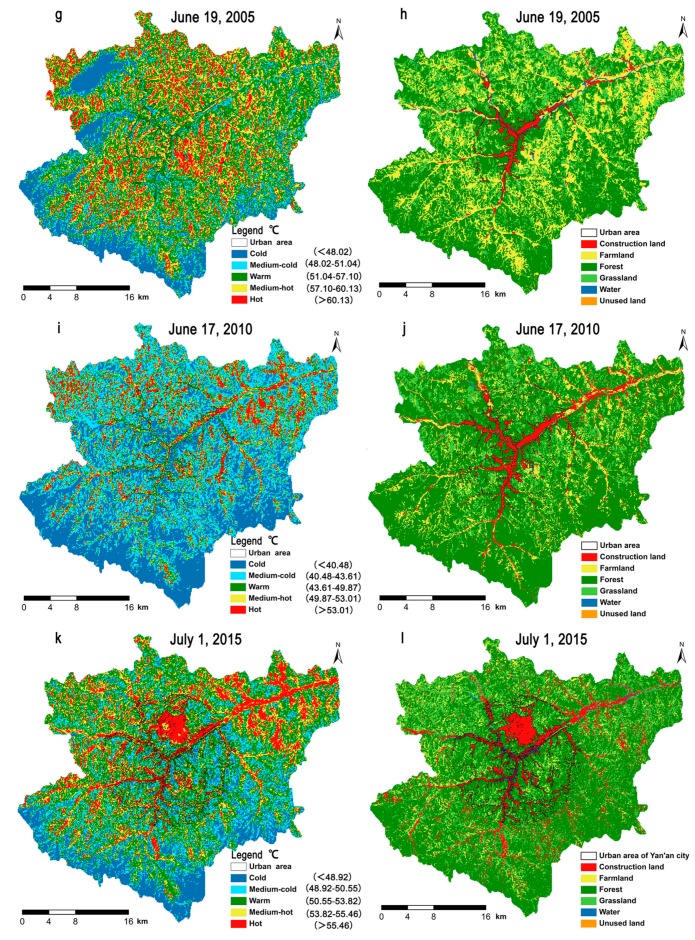
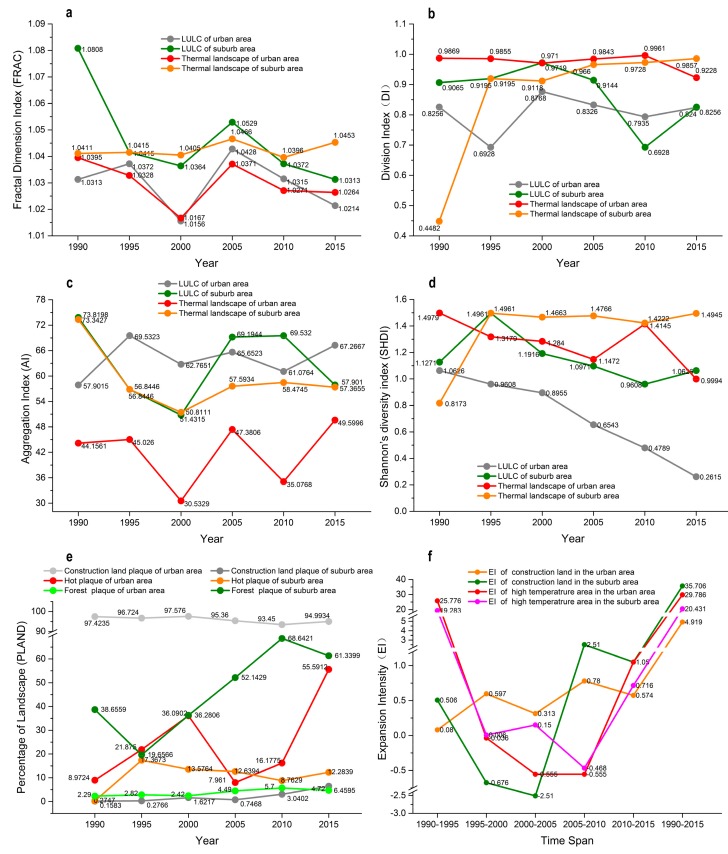
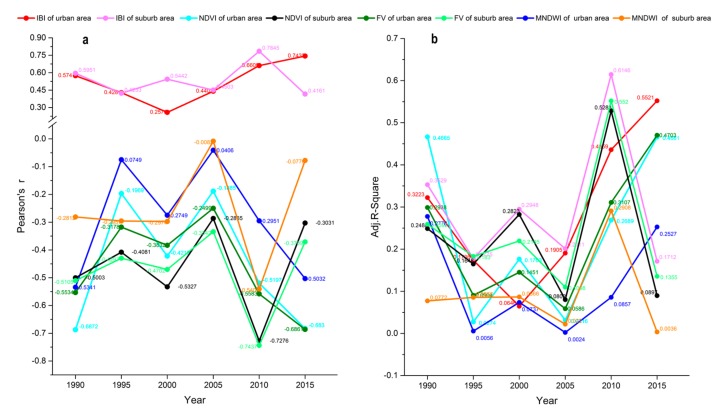
In this study Yan'an City, a typical hilly valley city, was considered as the study area in order to explain the relationships between the surface urban heat island (SUHI) and land use/land cover (LULC) types, the landscape pattern metrics of LULC types and land surface temperature (LST) and remote sensing indexes were retrieved from Landsat data during 1990-2015, and to find factors contributed to the green space cool island intensity (GSCI) through field measurements of 34 green spaces. The results showed that during 1990-2015, because of local anthropogenic activities, SUHI was mainly located in lower vegetation cover areas. There was a significant suburban-urban gradient in the average LST, as well as its heterogeneity and fluctuations. Six landscape metrics comprising the fractal dimension index, percentage of landscape, aggregation index, division index, Shannon's diversity index, and expansion intensity of the classified LST spatiotemporal changes were paralleled to LULC changes, especially for construction land, during the past 25 years. In the urban area, an index-based built-up index was the key positive factor for explaining LST increases, whereas the normalized difference vegetation index and modified normalized difference water index were crucial factors for explaining LST decreases during the study periods. In terms of the heat mitigation performance of green spaces, mixed forest was better than pure forest, and the urban forest configuration had positive effects on GSCI. The results of this study provide insights into the importance of species choice and the spatial design of green spaces for cooling the environment.
Keywords: land surface temperature; landscape pattern analysis; single-channel algorithm; spatial random point analysis; urban green space cooling island.
Conflict of interest statement
The authors declare no conflicts of interest.
Figures
Similar articles
-
Research on the spatiotemporal coupling relationships between land use/land cover compositions or patterns and the surface urban heat island effect.Environ Sci Pollut Res Int. 2022 Jun;29(26):39723-39742. doi: 10.1007/s11356-022-18838-3. Epub 2022 Feb 2. Environ Sci Pollut Res Int. 2022. PMID: 35107726
-
Evaluating the impact of landscape configuration, patterns and composition on land surface temperature: an urban heat island study in the Megacity Lahore, Pakistan.Environ Monit Assess. 2024 Jun 18;196(7):627. doi: 10.1007/s10661-024-12758-0. Environ Monit Assess. 2024. PMID: 38886252
-
Statistical analysis of land surface temperature-vegetation indexes relationship through thermal remote sensing.Ecotoxicol Environ Saf. 2015 Nov;121:39-44. doi: 10.1016/j.ecoenv.2015.07.004. Epub 2015 Jul 21. Ecotoxicol Environ Saf. 2015. PMID: 26209299
-
[Planning approach of urban blue-green space based on local climate optimization: A review].Ying Yong Sheng Tai Xue Bao. 2020 Nov;31(11):3935-3945. doi: 10.13287/j.1001-9332.202011.014. Ying Yong Sheng Tai Xue Bao. 2020. PMID: 33300745 Review. Chinese.
-
The urban heat island effect, its causes, and mitigation, with reference to the thermal properties of asphalt concrete.J Environ Manage. 2017 Jul 15;197:522-538. doi: 10.1016/j.jenvman.2017.03.095. Epub 2017 Apr 14. J Environ Manage. 2017. PMID: 28412623 Review.
Cited by
-
An Empirical Study on Low-Carbon: Human Resources Performance Evaluation.Int J Environ Res Public Health. 2018 Jan 3;15(1):62. doi: 10.3390/ijerph15010062. Int J Environ Res Public Health. 2018. PMID: 29301375 Free PMC article.
-
Effects of vegetation, terrain and soil layer depth on eight soil chemical properties and soil fertility based on hybrid methods at urban forest scale in a typical loess hilly region of China.PLoS One. 2018 Oct 18;13(10):e0205661. doi: 10.1371/journal.pone.0205661. eCollection 2018. PLoS One. 2018. PMID: 30335794 Free PMC article.
-
Effect modification of greenness on temperature-mortality relationship among older adults: A case-crossover study in China.Environ Res. 2021 Jun;197:111112. doi: 10.1016/j.envres.2021.111112. Epub 2021 Apr 8. Environ Res. 2021. PMID: 33838131 Free PMC article.
-
Effects of COVID-19 Restriction Policies on Urban Heat Islands in Some European Cities: Berlin, London, Paris, Madrid, and Frankfurt.Int J Environ Res Public Health. 2022 May 28;19(11):6579. doi: 10.3390/ijerph19116579. Int J Environ Res Public Health. 2022. PMID: 35682164 Free PMC article.
-
The Development Evaluation of Economic Zones in China.Int J Environ Res Public Health. 2018 Jan 2;15(1):56. doi: 10.3390/ijerph15010056. Int J Environ Res Public Health. 2018. PMID: 29301304 Free PMC article.
References
-
- Cohen B. Urban growth in developing countries: A review of current trends and a caution regarding existing forecasts. World Dev. 2004;32:23–51. doi: 10.1016/j.worlddev.2003.04.008. - DOI
-
- Angel S., Parent J., Civco D.L., Blei A., Potere D. The dimensions of global urban expansion: Estimates and projections for all countries, 2000–2050. Prog. Plan. 2011;75:53–107. doi: 10.1016/j.progress.2011.04.001. - DOI
-
- Li W.F., Bai Y., Chen Q.W., He K.T., Ji X.H., Han C.M. Discrepant impacts of land use and land cover on urban heat islands: A case study of Shanghai, China. Ecol. Indic. 2014;47:171–178. doi: 10.1016/j.ecolind.2014.08.015. - DOI
-
- Chen B., Chen G.Q., Yang Z.F., Jiang M.M. Ecological footprint accounting for energy and resource in China. Energy Policy. 2007;35:1599–1609. doi: 10.1016/j.enpol.2006.04.019. - DOI
-
- Zipper S.C., Schatz J., Singh A., Kucharik C.J., Townsend P.A., Loheide S.P. Urban heat island impacts on plant phenology: Intra-urban variability and response to land cover. Environ. Res. Lett. 2016;11:054023. doi: 10.1088/1748-9326/11/5/054023. - DOI
MeSH terms
LinkOut - more resources
Full Text Sources
Other Literature Sources
Miscellaneous
