. 2017 Oct 18;9(41):35847-35860.
doi: 10.1021/acsami.7b10673. Epub 2017 Oct 5.

Surface Chemistry of Perovskite-Type Electrodes During High Temperature CO2 Electrolysis Investigated by Operando Photoelectron Spectroscopy

Affiliations

Surface Chemistry of Perovskite-Type Electrodes During High Temperature CO2 Electrolysis Investigated by Operando Photoelectron Spectroscopy

Alexander K Opitz et al. ACS Appl Mater Interfaces. .

Abstract

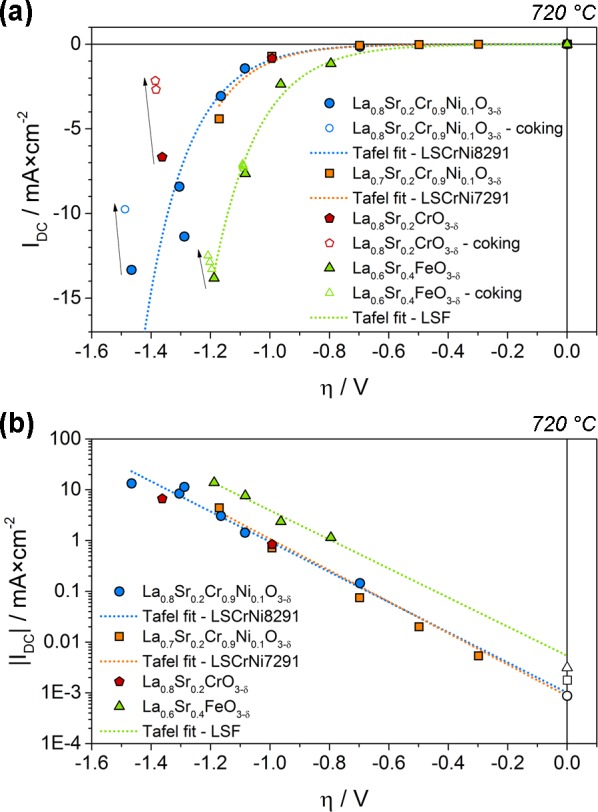
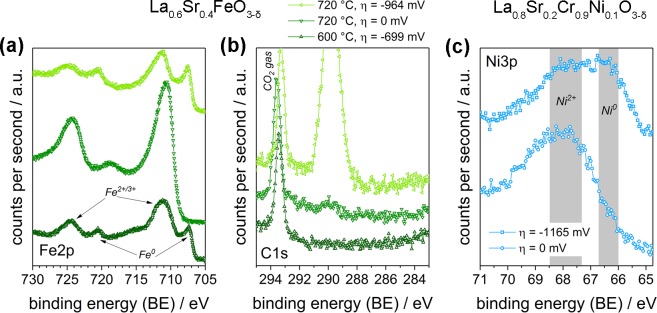
Any substantial move of energy sources from fossil fuels to renewable resources requires large scale storage of excess energy, for example, via power to fuel processes. In this respect electrochemical reduction of CO2 may become very important, since it offers a method of sustainable CO production, which is a crucial prerequisite for synthesis of sustainable fuels. Carbon dioxide reduction in solid oxide electrolysis cells (SOECs) is particularly promising owing to the high operating temperature, which leads to both improved thermodynamics and fast kinetics. Additionally, compared to purely chemical CO formation on oxide catalysts, SOECs have the outstanding advantage that the catalytically active oxygen vacancies are continuously formed at the counter electrode, and move to the working electrode where they reactivate the oxide surface without the need of a preceding chemical (e.g., by H2) or thermal reduction step. In the present work, the surface chemistry of (La,Sr)FeO3-δ and (La,Sr)CrO3-δ based perovskite-type electrodes was studied during electrochemical CO2 reduction by means of near-ambient pressure X-ray photoelectron spectroscopy (NAP-XPS) at SOEC operating temperatures. These measurements revealed the formation of a carbonate intermediate, which develops on the oxide surface only upon cathodic polarization (i.e., under sufficiently reducing conditions). The amount of this adsorbate increases with increasing oxygen vacancy concentration of the electrode material, thus suggesting vacant oxygen lattice sites as the predominant adsorption sites for carbon dioxide. The correlation of carbonate coverage and cathodic polarization indicates that an electron transfer is required to form the carbonate and thus to activate CO2 on the oxide surface. The results also suggest that acceptor doped oxides with high electron concentration and high oxygen vacancy concentration may be particularly suited for CO2 reduction. In contrast to water splitting, the CO2 electrolysis reaction was not significantly affected by metallic particles, which were exsolved from the perovskite electrodes upon cathodic polarization. Carbon formation on the electrode surface was only observed under very strong cathodic conditions, and the carbon could be easily removed by retracting the applied voltage without damaging the electrode, which is particularly promising from an application point of view.

Keywords: CO2 splitting; NAP-XPS; SOEC; defect chemistry; electron transfer; metal exsolution; mixed ionic electronic conductor; solid oxide electrolysis cell.


Conflict of interest statement

The authors declare no competing financial interest.

Figures

Figure 1
Figure 1
(a) Sketch (cross section) of an electrolysis cell mounted for NAP-XPS measurements. (b) SEM (top view) of a PLD-deposited LSF working electrode with embedded Pt thin film grid for current collection.
Figure 2
Figure 2
Current–overpotential characteristics of the four different WE materials measured at 720 °C in 0.25 mbar CO2. (a) Linear plot. The filled symbols are regular data points. The open symbols indicate measurements influenced by deposition of graphitic carbon (owing to large cathodic overpotentials). The corresponding degradation of the current is indicated by the arrows. The lines indicate the curves obtained from fitting the data in the logarithmic diagram below. (b) Tafel plot, i.e., logarithmic IV characteristics, of the data in part a. Data points influenced by carbon deposition related degradation are not shown. The lines were obtained by fitting the data points to the Tafel equation (see eq 7b). The open points at η = 0 V were not considered in these fits.
Figure 3
Figure 3
MS signal of oxygen normalized to the CO2 background plotted as a function of the measured DC current at 720 °C in 0.25 mbar CO2 for (a) LSCrNi8291 working electrode and (b) LSF working electrode. The lines indicate a linear fit in each case.
Figure 4
Figure 4
Comparison of C 1s spectra measured on the four different perovskite-type working electrodes at 720 °C in 0.25 mbar CO2 under different cathodic polarizations. In this plot binding energies were corrected by the applied overpotential for the sake of easier comparability of different spectra assuming a shift of the electrode’s Fermi level upon polarization by −1 eV/V., (This correction anticipates a result, which is discussed later in the text.)
Figure 5
Figure 5
Comparison of O 1s spectra (a) as well as C 1s spectra (b) of cathodically polarized (○) and nonpolarized (□) LSCrNi7291 working electrode at 720 °C in 0.25 mbar CO2. In the case of both types of spectra, an additional feature is visible upon polarization (top spectrum in each case). The components used for fitting are indicated as the filled peak areas, and the envelope of the fit is the solid blue line. (BE was not corrected to visualize peak shifts.)
Figure 6
Figure 6
Comparison of Fe 2p (a) and C 1s (b) spectra measured on LSF electrodes at 600 °C in 0.25 mbar CO2 at a cathodic polarization of −299 mV. In Fe 2p clearly the signature of both oxidic and metallic iron can be observed; in C 1s only the sharp peak of the CO2 gas phase is present (BE in C 1s spectra were corrected by η for the sake of easier comparability). (c) Ni 3p spectra measured on LSCrNi8291 at 720 °C with and without cathodic polarization showing the exsolution of Ni at the electrode surface (BE corrected by η). The gray shaded areas indicate typical 3p binding energies for metallic nickel and Ni2+ in oxides.,
Figure 7
Figure 7
(a) Difference between the binding energy of the unidentified C 1s species at ca. 290 eV and graphitic carbon plotted versus the applied overpotential. The solid line is a linear fit considering all data points. (b) Plot of the XPS peak area of the shoulder in O1s spectra at 532−533 eV versus the peak area of the species in C 1s at ca. 290 eV. The solid gray line is a linear fit considering all data points. The dashed and the dash-dotted line indicate the corresponding peak area ration from CO2 and CO gas phase measurements, respectively. (c) Difference in binding energy of the unidentified species in O 1s and C 1s spectra plotted versus the applied overpotential. The dashed and the dash-dotted line indicate the corresponding values from CO2 and CO gas phase measurements, respectively. The black symbols indicate the values extracted from the CO2 gas phase peak of “regular” NAP-XPS measurements (i.e., performed on perovskite electrodes). The dotted line indicates the corresponding BE difference between O 1s and C 1s reported for SrCO3.,
Figure 8
Figure 8
Peak area of the carbonate C 1s peak plotted as a function of the applied overpotential for four different electrode materials measured at 720 °C in 0.25 mbar CO2.
Figure 9
Figure 9
Sketch of the proposed mechanism of the formation of the carbonate adsorbate detected by NAP-XPS. For the sake of simplicity only a cut through a (100) lattice plane occupied by B and O, with the surface parallel to (110), is depicted, thus not showing the full perovskite structure. (a) CO2 adsorbing into an oxygen vacancy, followed by an electron transfer from a polaron (or the conduction band). (b) CO2 adsorption and first electron transfer occurring in one step by adsorption into a singly charged oxygen vacancy (i.e., a vacancy with a trapped electron). In either case a or b, a bidentate carbonate radical results, which is regarded as a reaction intermediate of CO2 reduction to CO.
Figure 10
Figure 10
(a) C 1s spectra measured on LSCrNi8291 at 720 °C in 0.25 mbar CO2 at different cathodic polarizations. Coking occurs at the highest overpotential (η = −1450 mV) observable by evolution of an asymmetric peak at 284–285 eV. (b) With prolonged time the amount of deposited graphite increases, but it is immediately removed upon retracting the polarization. (BE in parts a and b not corrected.) (c) MS signals of O2 and CO (normalized to CO2 background) with visible steps corresponding to the indicated overpotential.

References

    1. Lewis N. S.; Nocera D. G. Powering the Planet: Chemical Challenges in Solar Energy Utilization. Proc. Natl. Acad. Sci. U. S. A. 2006, 103, 15729–15735. 10.1073/pnas.0603395103. - DOI - PMC - PubMed
    1. Krol R. v. d.; Grätzel M. In Photoelectrochemical Hydrogen Production; Tuller H. L., Ed.; Springer: New York, 2012; p 321.
    1. Kurzweil P.HISTORY|Electrochemistry. In Encyclopedia of Electrochemical Power Sources; Elsevier: Amsterdam, 2009; pp 533–554.
    1. Pöhlmann F.; Jess A. Influence of Syngas Composition on the Kinetics of Fischer–Tropsch Synthesis of using Cobalt as Catalyst. Energy Technol. 2016, 4, 55–64. 10.1002/ente.201500216. - DOI
    1. Graves C.; Ebbesen S. D.; Mogensen M.; Lackner K. S. Sustainable Hydrocarbon Fuels by Recycling CO2 and H2O with Renewable or Nuclear Energy. Renewable Sustainable Energy Rev. 2011, 15, 1–23. 10.1016/j.rser.2010.07.014. - DOI