Reconciling conflicting models for global control of cell-cycle transcription
- PMID: 28934013
- PMCID: PMC5638368
- DOI: 10.1080/15384101.2017.1367073
Reconciling conflicting models for global control of cell-cycle transcription
Abstract
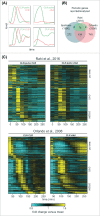
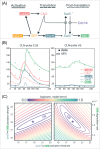
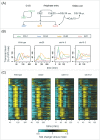
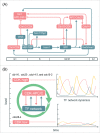
Models for the control of global cell-cycle transcription have advanced from a CDK-APC/C oscillator, a transcription factor (TF) network, to coupled CDK-APC/C and TF networks. Nonetheless, current models were challenged by a recent study that concluded that the cell-cycle transcriptional program is primarily controlled by a CDK-APC/C oscillator in budding yeast. Here we report an analysis of the transcriptome dynamics in cyclin mutant cells that were not queried in the previous study. We find that B-cyclin oscillation is not essential for control of phase-specific transcription. Using a mathematical model, we demonstrate that the function of network TFs can be retained in the face of significant reductions in transcript levels. Finally, we show that cells arrested at mitotic exit with non-oscillating levels of B-cyclins continue to cycle transcriptionally. Taken together, these findings support a critical role of a TF network and a requirement for CDK activities that need not be periodic.
Keywords: Cell-cycle transcription; mathematical modeling; time-series transcriptomics; transcriptional network.
Figures


Comment in
-
Better together: Unifying discordant cell-cycle oscillator models.Cell Cycle. 2018;17(1):9-10. doi: 10.1080/15384101.2017.1389197. Epub 2018 Jan 2. Cell Cycle. 2018. PMID: 29108455 Free PMC article. No abstract available.
Similar articles
-
Layers of regulation of cell-cycle gene expression in the budding yeast Saccharomyces cerevisiae.Mol Biol Cell. 2018 Nov 1;29(22):2644-2655. doi: 10.1091/mbc.E18-04-0255. Epub 2018 Sep 12. Mol Biol Cell. 2018. PMID: 30207828 Free PMC article.
-
Checkpoints couple transcription network oscillator dynamics to cell-cycle progression.Genome Biol. 2014 Sep 5;15(9):446. doi: 10.1186/s13059-014-0446-7. Genome Biol. 2014. PMID: 25200947 Free PMC article.
-
Global control of cell-cycle transcription by coupled CDK and network oscillators.Nature. 2008 Jun 12;453(7197):944-7. doi: 10.1038/nature06955. Epub 2008 May 7. Nature. 2008. PMID: 18463633 Free PMC article.
-
Transcription networks and cyclin/CDKs: the yin and yang of cell cycle oscillators.Cell Cycle. 2008 Sep 1;7(17):2626-9. doi: 10.4161/cc.7.17.6515. Epub 2008 Sep 26. Cell Cycle. 2008. PMID: 18758238 Review.
-
[Molecular mechanisms controlling the cell cycle: fundamental aspects and implications for oncology].Cancer Radiother. 2001 Apr;5(2):109-29. doi: 10.1016/s1278-3218(01)00087-7. Cancer Radiother. 2001. PMID: 11355576 Review. French.
Cited by
-
Experimental guidance for discovering genetic networks through hypothesis reduction on time series.PLoS Comput Biol. 2022 Oct 10;18(10):e1010145. doi: 10.1371/journal.pcbi.1010145. eCollection 2022 Oct. PLoS Comput Biol. 2022. PMID: 36215333 Free PMC article.
-
Better together: Unifying discordant cell-cycle oscillator models.Cell Cycle. 2018;17(1):9-10. doi: 10.1080/15384101.2017.1389197. Epub 2018 Jan 2. Cell Cycle. 2018. PMID: 29108455 Free PMC article. No abstract available.
-
Quantitative Studies for Cell-Division Cycle Control.Front Physiol. 2019 Aug 19;10:1022. doi: 10.3389/fphys.2019.01022. eCollection 2019. Front Physiol. 2019. PMID: 31496950 Free PMC article. Review.
-
Layers of regulation of cell-cycle gene expression in the budding yeast Saccharomyces cerevisiae.Mol Biol Cell. 2018 Nov 1;29(22):2644-2655. doi: 10.1091/mbc.E18-04-0255. Epub 2018 Sep 12. Mol Biol Cell. 2018. PMID: 30207828 Free PMC article.
-
The cell-cycle transcriptional network generates and transmits a pulse of transcription once each cell cycle.Cell Cycle. 2019 Feb;18(4):363-378. doi: 10.1080/15384101.2019.1570655. Epub 2019 Feb 5. Cell Cycle. 2019. PMID: 30668223 Free PMC article.
References
-
- Spellman PT, Sherlock G, Zhang MQ, Iyer VR, Anders K, Eisen MB, Brown PO, Botstein D, Futcher B. Comprehensive Identification of Cell Cycle–regulated Genes of the Yeast Saccharomyces cerevisiae by Microarray Hybridization. Mol Biol Cell. 1998;9:3273-97. doi: 10.1091/mbc.9.12.3273. PMID:9843569 - DOI - PMC - PubMed
-
- Whitfield ML, Sherlock G, Saldanha AJ, Murray JI, Ball CA, Alexander KE, Matese JC, Perou CM, Hurt MM, Brown PO, et al.. Identification of genes periodically expressed in the human cell cycle and their expression in tumors. Mol Biol Cell. 2002;13:1977-2000. doi: 10.1091/mbc.02-02-0030. PMID:12058064 - DOI - PMC - PubMed
MeSH terms
Substances
LinkOut - more resources
Full Text Sources
Other Literature Sources
Molecular Biology Databases
Miscellaneous
