

Children's Lead Exposure: A Multimedia Modeling Analysis to Guide Public Health Decision-Making
- PMID: 28934096
- PMCID: PMC5915183
- DOI: 10.1289/EHP1605
Children's Lead Exposure: A Multimedia Modeling Analysis to Guide Public Health Decision-Making
Abstract
Background: Drinking water and other sources for lead are the subject of public health concerns around the Flint, Michigan, drinking water and East Chicago, Indiana, lead in soil crises. In 2015, the U.S. Environmental Protection Agency (EPA)'s National Drinking Water Advisory Council (NDWAC) recommended establishment of a "health-based, household action level" for lead in drinking water based on children's exposure.
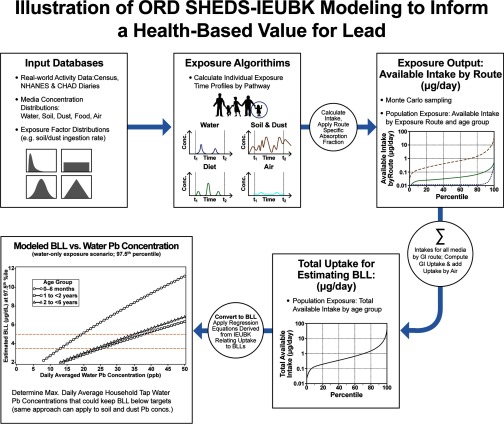
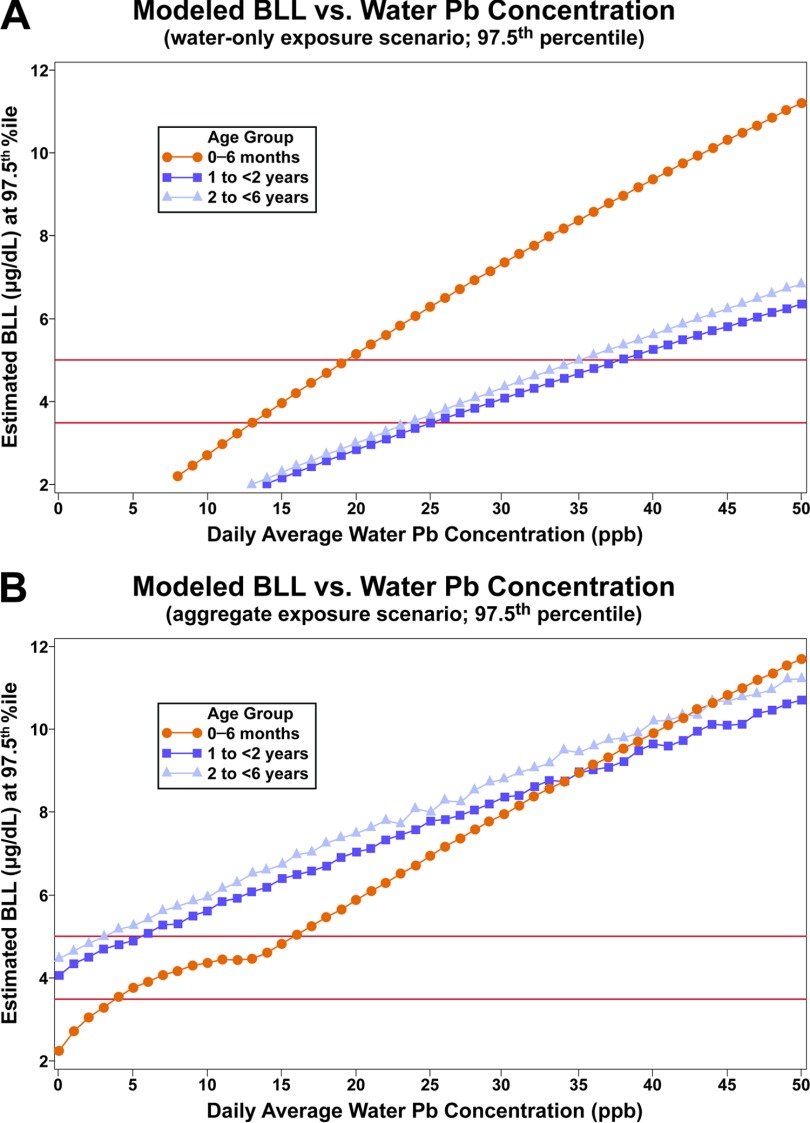
Objectives: The primary objective was to develop a coupled exposure-dose modeling approach that can be used to determine what drinking water lead concentrations keep children's blood lead levels (BLLs) below specified values, considering exposures from water, soil, dust, food, and air. Related objectives were to evaluate the coupled model estimates using real-world blood lead data, to quantify relative contributions by the various media, and to identify key model inputs.
Methods: A modeling approach using the EPA's Stochastic Human Exposure and Dose Simulation (SHEDS)-Multimedia and Integrated Exposure Uptake and Biokinetic (IEUBK) models was developed using available data. This analysis for the U.S. population of young children probabilistically simulated multimedia exposures and estimated relative contributions of media to BLLs across all population percentiles for several age groups.
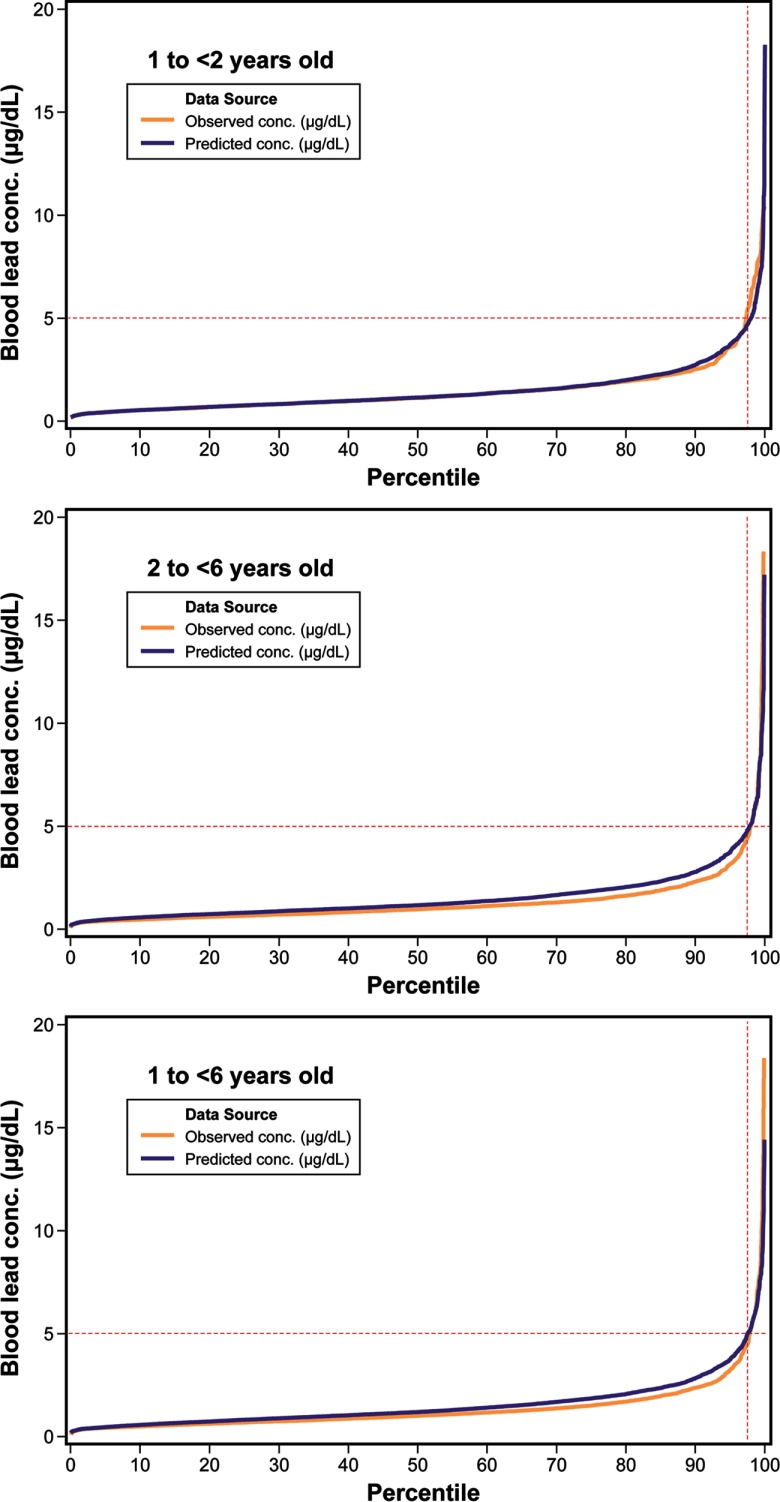
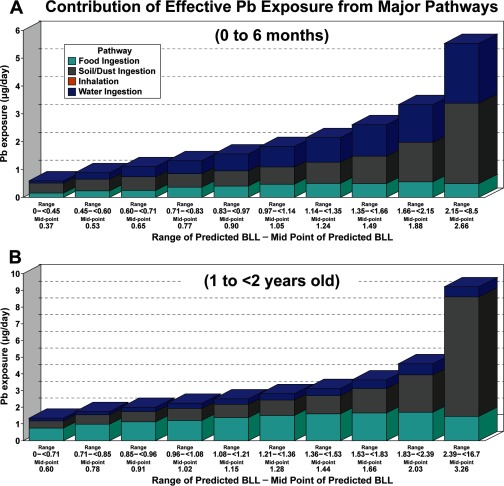
Results: Modeled BLLs compared well with nationally representative BLLs (0-23% relative error). Analyses revealed relative importance of soil and dust ingestion exposure pathways and associated Pb intake rates; water ingestion was also a main pathway, especially for infants.
Conclusions: This methodology advances scientific understanding of the relationship between lead concentrations in drinking water and BLLs in children. It can guide national health-based benchmarks for lead and related community public health decisions. https://doi.org/10.1289/EHP1605.
Figures
References
-
- ATSDR (Agency for Toxics Substances and Disease Registry). 2016. Meeting of the Lead Poisoning Prevention Subcommittee of the NCEH/ATSDR Board of Scientific Counselors. 19 September 2016, Atlanta, GA, Record of the Proceedings https://www.atsdr.cdc.gov/science/lpp/docs/lead_subcommittee_minutes_9_1... [accessed 13 July 2017].
-
- CDC. 2013a. (Centers for Disease Control and Prevention). National Health and Nutrition Examination Survey (NHANES 2009–2010). https://wwwn.cdc.gov/nchs/nhanes/search/datapage.aspx?Component=Laborato... [accessed 13 July 2017].
-
- CDC. 2013b. National Health and Nutrition Examination Survey (NHANES 2011–2012). https://wwwn.cdc.gov/nchs/nhanes/search/datapage.aspx?Component=Laborato... [accessed 13 July 2017].
-
- CDC. 2016. National Health and Nutrition Examination Survey (NHANES 2013–2014). https://wwwn.cdc.gov/nchs/nhanes/search/datapage.aspx?Component=Laborato... [accessed 13 July 2017].
Publication types
MeSH terms
Substances
Grants and funding
LinkOut - more resources
Full Text Sources
Other Literature Sources
Research Materials