. 2017 Sep 21;18(10):2025.
doi: 10.3390/ijms18102025.

Isoliquiritigenin Induces Autophagy and Inhibits Ovarian Cancer Cell Growth

Affiliations

Isoliquiritigenin Induces Autophagy and Inhibits Ovarian Cancer Cell Growth

Hsin-Yuan Chen et al. Int J Mol Sci. .

Abstract

Ovarian cancer is one of the commonest gynecologic malignancies, which has a poor prognosis for patients at the advanced stage. Isoliquiritigenin (ISL), an active flavonoid component of the licorice plant, previously demonstrated antioxidant, anti-inflammatory, and tumor suppressive effects. In this study, we investigated the antitumor effect of ISL on human ovarian cancer in vitro using the human ovarian cancer cell lines, OVCAR5 and ES-2, as model systems. Our results show that ISL significantly inhibited the viability of cancer cells in a concentration- and time-dependent manner. Flow cytometry analysis indicated that ISL induced G2/M phase arrest. Furthermore, the expression of cleaved PARP, cleaved caspase-3, Bax/Bcl-2 ratio, LC3B-II, and Beclin-1 levels were increased in western blot analysis. To clarify the role of autophagy and apoptosis in the effect of ISL, we used the autophagy inhibitor-3-methyladenine (3-MA) to attenuate the punctate fluorescence staining pattern of the p62/sequestosome 1 (SQSTM1, red fluorescence) and LC3 (green fluorescence) proteins after ISL treatment, and 3-MA inhibited the cytotoxicity of ISL. These findings provide new information about the link between ISL-induced autophagy and apoptosis and suggest that ISL is a candidate agent for the treatment of human ovarian cancer.

Keywords: apoptosis; autophagy; isoliquiritigenin; ovarian cancer.


Conflict of interest statement

The authors declare no conflict of interest.

Figures

Figure 1
Figure 1
Cytotoxicity of isoliquiritigenin on ovarian cancer cells. (a) OVCAR5 and (b) ES-2 cells were exposed to control (dimethyl sulfoxide, DMSO) and the indicated concentration of ISL from 1 to 100 μM follow by 24–48 h incubation. Cell proliferation was measured by MTS assay; (c) The morphology of OVCAR5 and ES-2 cells after treated with control (DMSO) and 5, 10, 25, and 50 μΜ of ISL in media containing 1% FBS for 48 h. Bars equal to 100 μm; (d) Number of viable cells after treated with control (DMSO) and 5, 10, 25, and 50 μΜ of ISL in media containing 1% fetal bovine serum (FBS) for 48 h. Cell viability was determined by trypan blue exclusion test. The results are expressed as means ± SD of three independent experiments. * p < 0.05 and ** p < 0.001 compared with control.
Figure 2
Figure 2
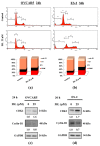
ISL induces G2/M cell cycle arrest in ovarian cancer cells. Cells were plated in 100 mm diameter dishes at 1 × 10⁶ cells in medium with 10% FBS until attach the plate bottom and treated with ISL 25 μM for 24 or 36 h. (a,b) The cells were stained with propidium iodide (PI), and the cell cycle distribution was analyzed by flow cytometry. The vertical axis represents the number of cells and the horizontal axis represents the intensity of PI staining. The cell cycle distribution was shown in bar graph. The vertical numbers represents the cell population percentage in cell cycle sub G1, G1, S and G2/M phase, the horizontal number represents the dose of ISL; (c,d) Cell lysates were separated by sodium dodecyl sulfate polyacrylamide gel electrophoresis (SDS-PAGE) and analyzed on western blots with the indicated antibodies. GAPDH was used as a loading control. The values of the band intensity represent the densitometric estimation of each band normalized by GAPDH.
Figure 3
Figure 3
ISL induces the expression of autophagy and apoptosis-associated protein in ovarian cancer cells. OVCAR5 and ES-2 cells were treated with ISL (10, 25, 50 μM) for 48 h (ad) and treated with ISL 25 μM for 3, 6, 12, 18, 24, 36, and 48 h (eh). Cell lysates were separated by SDS-PAGE and analyzed on western blots with the indicated antibodies. GAPDH was used as a loading control. The values of the band intensity are expressed as the ratio (cleaved PARP or LC3B-II or cleaved caspase-3 or Bax/Bcl-2 or Beclin-1:GAPDH) relative to control.
Figure 3
Figure 3
ISL induces the expression of autophagy and apoptosis-associated protein in ovarian cancer cells. OVCAR5 and ES-2 cells were treated with ISL (10, 25, 50 μM) for 48 h (ad) and treated with ISL 25 μM for 3, 6, 12, 18, 24, 36, and 48 h (eh). Cell lysates were separated by SDS-PAGE and analyzed on western blots with the indicated antibodies. GAPDH was used as a loading control. The values of the band intensity are expressed as the ratio (cleaved PARP or LC3B-II or cleaved caspase-3 or Bax/Bcl-2 or Beclin-1:GAPDH) relative to control.
Figure 4
Figure 4
ISL triggered autophagy in ovarian cancer cells. OVCAR5 and ES-2 cells were treated with ISL 25 μM for 24 h with or without autophagy inhibitor (3-MA) pretreatment (5 mM, 4 h), and observed the co-localization of LC3 puncta (green) and p62/SQSTM1 puncta (red, demarcation for the lysosome) in cells, DAPI (4′,6-Diamidino-2-Phenylindole) was used for nucleus staining. Bars equal to 100 μm (a,b). OVCAR5 and ES-2 cell lysates were separated by SDS-PAGE and analyzed on western blot with autophagosome formation marker LC3B-I and LC3B-II. GAPDH was used as a loading control. The values of the band intensity are expressed as the ratio LC3B-II:GAPDH relative to control (c,d).
Figure 5
Figure 5
ISL induced apoptosis in ovarian cancer cells. OVCAR5 and ES-2 cells were treated with ISL 25 μM for 24 or 36 h with or without autophagy inhibitor (3-MA) pretreatment (5 mM, 4 h), cells were harvested and stained with Annexin V-FITC (fluorescein isothiocyanate) and PI (propidium iodide), and apoptotic cell death was analyzed using flow cytometry, relative proportions of both early and late apoptosis are indicated in right lower and right upper quadrant, respectively in each treatment group (a,b). OVCAR5 and ES-2 cell lysates were separated by SDS-PAGE and analyzed on western blots with the apoptosis markers total PARP and cleaved PARP. GAPDH was used as a loading control. The values of the band intensity are expressed as the ratio cleaved PARP:GAPDH relative to control (c,d). * p < 0.05 compared with control group; # p < 0.05 compared with ISL 25 μΜ group.

References

    1. Siegel R.L., Miller K.D., Jemal A. Cancer statistics, 2017. CA Cancer J. Clin. 2017;67:7–30. doi: 10.3322/caac.21387. - DOI - PubMed
    1. Health Grove, 2017. [(accessed on 4 February 2016)]; Available online: http://conditions.healthgrove.com/l/754/Ovarian-Cancer#Global%20Statisti....
    1. Jayson G.C., Kohn E.C., Kitchener H.C., Ledermann J.A. Ovarian cancer. Lancet. 2014;384:1376–1388. doi: 10.1016/S0140-6736(13)62146-7. - DOI - PubMed
    1. American Cancer Society, 2017. [(accessed on 1 July 2016)]; Available online: https://www.cancer.org/cancer/ovarian-cancer/detection-diagnosis-staging....
    1. Cao Y., Wang Y., Ji C., Ye J. Determination of liquiritigenin and isoliquiritigenin in Glycyrrhiza uralensis and its medicinal preparations by capillary electrophoresis with electrochemical detection. J. Chromatogr. A. 2004;1042:203–209. doi: 10.1016/j.chroma.2004.05.049. - DOI - PubMed

MeSH terms

LinkOut - more resources