

Rural and Urban Differences in Passenger-Vehicle-Occupant Deaths and Seat Belt Use Among Adults - United States, 2014
- PMID: 28934184
- PMCID: PMC5829699
- DOI: 10.15585/mmwr.ss6617a1
Rural and Urban Differences in Passenger-Vehicle-Occupant Deaths and Seat Belt Use Among Adults - United States, 2014
Abstract
Problem/condition: Motor-vehicle crashes are a leading cause of death in the United States. Compared with urban residents, rural residents are at an increased risk for death from crashes and are less likely to wear seat belts. These differences have not been well described by levels of rurality.
Reporting period: 2014.
Description of systems: Data from the Fatality Analysis Reporting System (FARS) and the Behavioral Risk Factor Surveillance System (BRFSS) were used to identify passenger-vehicle-occupant deaths from motor-vehicle crashes and estimate the prevalence of seat belt use. FARS, a census of U.S. motor-vehicle crashes involving one or more deaths, was used to identify passenger-vehicle-occupant deaths among adults aged ≥18 years. Passenger-vehicle occupants were defined as persons driving or riding in passenger cars, light trucks, vans, or sport utility vehicles. Death rates per 100,000 population, age-adjusted to the 2000 U.S. standard population and the proportion of occupants who were unrestrained at the time of the fatal crash, were calculated. BRFSS, an annual, state-based, random-digit-dialed telephone survey of the noninstitutionalized U.S. civilian population aged ≥18 years, was used to estimate prevalence of seat belt use. FARS and BRFSS data were analyzed by a six-level rural-urban designation, based on the U.S. Department of Agriculture 2013 rural-urban continuum codes, and stratified by census region and type of state seat belt enforcement law (primary or secondary).
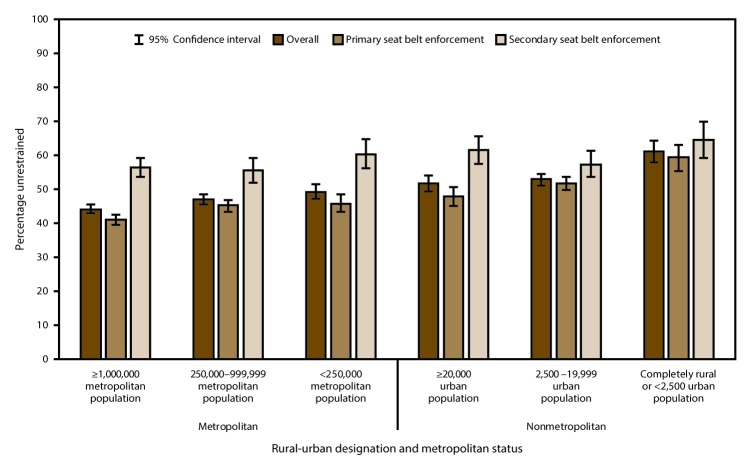
Results: Within each census region, age-adjusted passenger-vehicle-occupant death rates per 100,000 population increased with increasing rurality, from the most urban to the most rural counties: South, 6.8 to 29.2; Midwest, 5.3 to 25.8; West, 3.9 to 40.0; and Northeast, 3.5 to 10.8. (For the Northeast, data for the most rural counties were not reported because of suppression criteria; comparison is for the most urban to the second-most rural counties.) Similarly, the proportion of occupants who were unrestrained at the time of the fatal crash increased as rurality increased. Self-reported seat belt use in the United States decreased with increasing rurality, ranging from 88.8% in the most urban counties to 74.7% in the most rural counties. Similar differences in age-adjusted death rates and seat belt use were observed in states with primary and secondary seat belt enforcement laws.
Interpretation: Rurality was associated with higher age-adjusted passenger-vehicle-occupant death rates, a higher proportion of unrestrained passenger-vehicle-occupant deaths, and lower seat belt use among adults in all census regions and regardless of state seat belt enforcement type.
Public health actions: Seat belt use decreases and age-adjusted passenger-vehicle-occupant death rates increase with increasing levels of rurality. Improving seat belt use remains a critical strategy to reduce crash-related deaths in the United States, especially in rural areas where seat belt use is lower and age-adjusted death rates are higher than in urban areas. States and communities can consider using evidence-based interventions to reduce rural-urban disparities in seat belt use and passenger-vehicle-occupant death rates.
Figures

References
-
- National Highway Traffic Safety Administration. Traffic safety facts 2015 data: rural/urban comparison of traffic fatalities. Washington, DC: National Highway Traffic Safety Administration; 2017. https://crashstats.nhtsa.dot.gov/Api/Public/Publication/812393
-
- US Census Bureau. Measuring America: our changing landscape. Washington, DC: US Census Bureau; 2016. https://www.census.gov/library/visualizations/2016/comm/acs-rural-urban....
-
- National Highway Traffic Safety Administration. Traffic safety facts 2015 data: passenger vehicles. Washington, DC: National Highway Traffic Safety Administration; 2017. https://crashstats.nhtsa.dot.gov/Api/Public/ViewPublication/812413
MeSH terms
LinkOut - more resources
Full Text Sources
Other Literature Sources
Medical
Research Materials