

Arginine vasopressin ameliorates spatial learning impairments in chronic cerebral hypoperfusion via V1a receptor and autophagy signaling partially
- PMID: 28934194
- PMCID: PMC5538111
- DOI: 10.1038/tp.2017.121
Arginine vasopressin ameliorates spatial learning impairments in chronic cerebral hypoperfusion via V1a receptor and autophagy signaling partially
Abstract
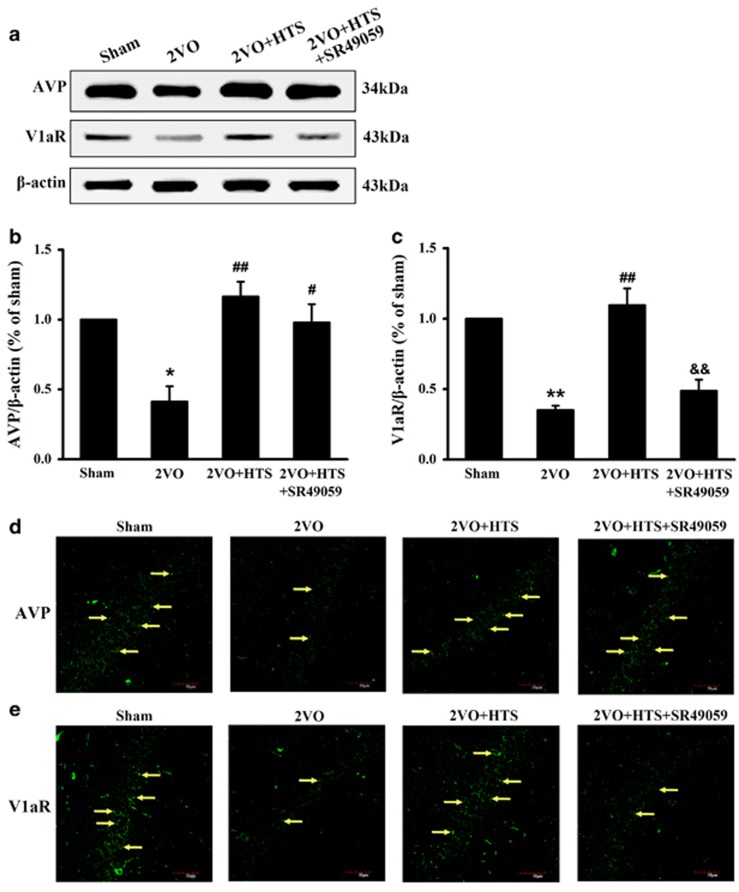
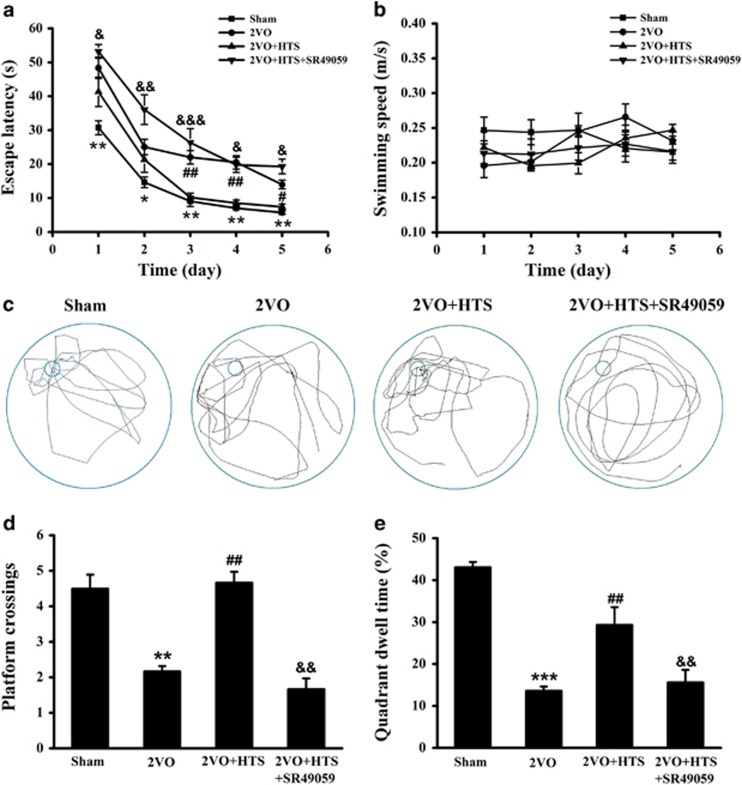
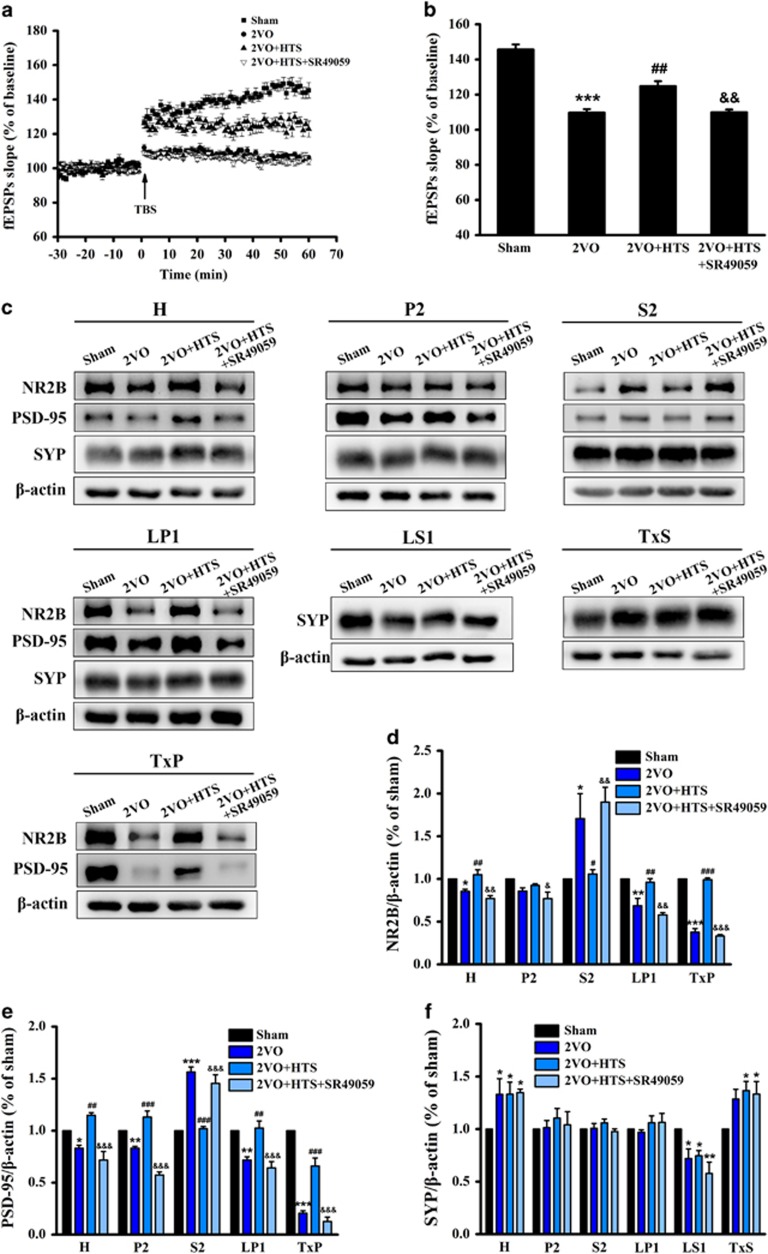
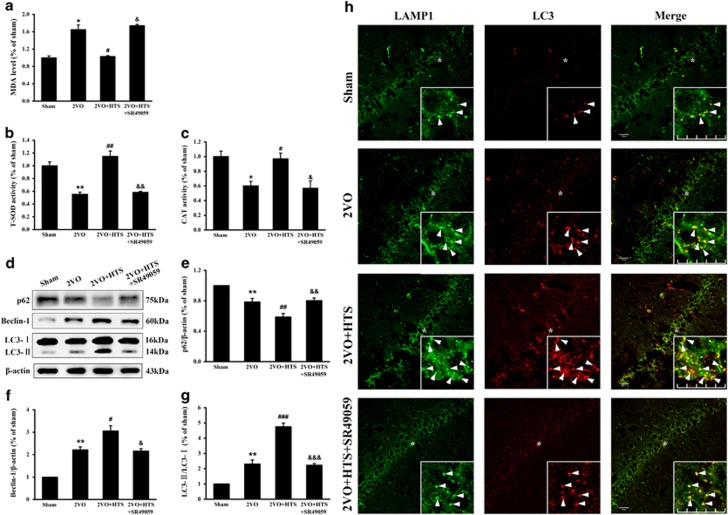
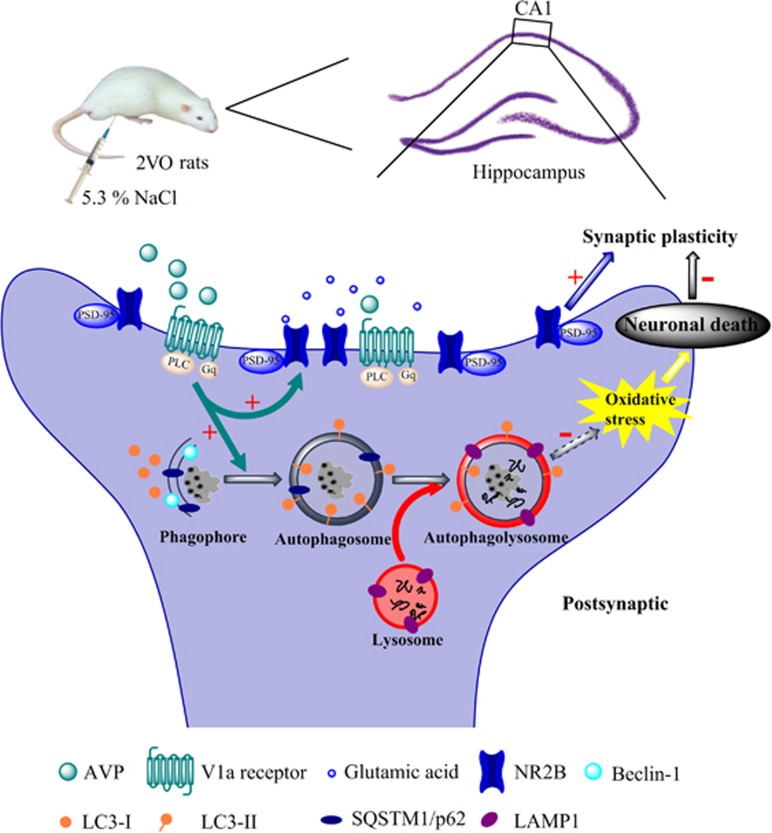
Chronic cerebral hypoperfusion (CCH) is a major factor contributing to neurological disorders and cognitive decline. Autophagy activation is believed to provide both beneficial and detrimental roles during hypoxic/ischemic cellular injury. Although arginine vasopressin (AVP) has been strongly involved in many behaviors, especially in learning and memory, the effects of AVP on CCH and their molecular mechanisms remain unclear. Here, to investigate whether there was neuroprotective effects of AVP on CCH through V1a receptor (an AVP receptor) signaling, permanent bilateral carotid arteries occlusion (two vessel occlusion, 2VO) was used to establish a rat model of CCH, and hypertonic saline (5.3%) was injected intraperitoneally to induce the secretion of AVP. Results showed that hypertonic saline effectively alleviated spatial learning and memory deficit, enhanced synaptic plasticity of CA3-CA1 hippocampal synapses, upregulated N-methyl-d-aspartate receptor subunit 2B (NR2B) and postsynaptic density protein 95 (PSD-95) surface expressions, reduced oxidative stress and increased Nissl bodies in 2VO model rats. These phenomena were significantly decreased by V1a receptor antagonist SR49059. Interestingly, hypertonic saline also upregulated autophagy in the hippocampus of 2VO rats partly through V1a receptor. These findings imply that AVP has a beneficial role for the treatment of cognitive impairments partly through V1a receptor signaling in CCH, which is possibly related to improving synaptic plasticity by promoting NR2B and PSD-95 externalization and by enhancing autophagy.
Conflict of interest statement
The authors declare no conflict of interest.
Figures
Similar articles
-
Arginine vasopressin attenuates dysfunction of hippocampal theta and gamma oscillations in chronic cerebral hypoperfusion via V1a receptor.Brain Res Bull. 2019 Nov;153:84-92. doi: 10.1016/j.brainresbull.2019.08.012. Epub 2019 Aug 17. Brain Res Bull. 2019. PMID: 31430514
-
Long-lasting spatial learning and memory impairments caused by chronic cerebral hypoperfusion associate with a dynamic change of HCN1/HCN2 expression in hippocampal CA1 region.Neurobiol Learn Mem. 2015 Sep;123:72-83. doi: 10.1016/j.nlm.2015.05.005. Epub 2015 May 28. Neurobiol Learn Mem. 2015. PMID: 26021557
-
Nimodipine represses AMPK phosphorylation and excessive autophagy after chronic cerebral hypoperfusion in rats.Brain Res Bull. 2018 Jun;140:88-96. doi: 10.1016/j.brainresbull.2018.03.019. Epub 2018 Apr 3. Brain Res Bull. 2018. PMID: 29625150
-
[Revisiting the vasopressin V2 receptor].Sheng Li Xue Bao. 2024 Dec 25;76(6):893-907. Sheng Li Xue Bao. 2024. PMID: 39780566 Review. Chinese.
-
[Vasopressin and angiogenesis].J Soc Biol. 2009;203(1):39-47. doi: 10.1051/jbio:2009005. Epub 2009 Apr 10. J Soc Biol. 2009. PMID: 19358810 Review. French.
Cited by
-
AVP(4-8) Improves Cognitive Behaviors and Hippocampal Synaptic Plasticity in the APP/PS1 Mouse Model of Alzheimer's Disease.Neurosci Bull. 2020 Mar;36(3):254-262. doi: 10.1007/s12264-019-00434-0. Epub 2019 Oct 12. Neurosci Bull. 2020. PMID: 31605298 Free PMC article.
-
Upregulation of RasGRF1 ameliorates spatial cognitive dysfunction in mice after chronic cerebral hypoperfusion.Aging (Albany NY). 2023 Apr 12;15(8):2999-3020. doi: 10.18632/aging.204654. Epub 2023 Apr 12. Aging (Albany NY). 2023. PMID: 37053022 Free PMC article.
-
Identification of cerebrospinal fluid biomarker candidates for anti-N-methyl-D-aspartate receptor encephalitis: High-throughput proteomic investigation.Front Immunol. 2022 Oct 26;13:971659. doi: 10.3389/fimmu.2022.971659. eCollection 2022. Front Immunol. 2022. PMID: 36389787 Free PMC article.
-
Ambiguous Effects of Autophagy Activation Following Hypoperfusion/Ischemia.Int J Mol Sci. 2018 Sep 13;19(9):2756. doi: 10.3390/ijms19092756. Int J Mol Sci. 2018. PMID: 30217100 Free PMC article. Review.
-
Embelin Improves the Spatial Memory and Hippocampal Long-Term Potentiation in a Rat Model of Chronic Cerebral Hypoperfusion.Sci Rep. 2019 Oct 10;9(1):14507. doi: 10.1038/s41598-019-50954-y. Sci Rep. 2019. PMID: 31601902 Free PMC article.
References
-
- Farkas E, Luiten PG, Bari F. Permanent, bilateral common carotid artery occlusion in the rat: a model for chronic cerebral hypoperfusion-related neurodegenerative diseases. Brain Res Rev 2007; 54: 162–180. - PubMed
-
- Román GC. Brain hypoperfusion: a critical factor in vascular dementia. Neurol Res 2004; 26: 454–458. - PubMed
-
- Fotuhi M, Hachinski V, Whitehouse PJ. Changing perspectives regarding late-life dementia. Nat Rev Neurol 2009; 5: 649–658. - PubMed
-
- De la Torre J, Fortin T. A chronic physiological rat model of dementia. Behav Brain Res 1994; 63: 35–40. - PubMed
-
- Torre JCDL, Fortin T, Park GAS, Pappas BA, Richard MT. Brain blood flow restoration 'rescues' chronically damaged rat CA1 neurons. Brain Res 1993; 623: 6–15. - PubMed
Publication types
MeSH terms
Substances
LinkOut - more resources
Full Text Sources
Other Literature Sources
Miscellaneous
