. 2017 Sep 21;13(9):e1005754.
doi: 10.1371/journal.pcbi.1005754. eCollection 2017 Sep.

Spatiotemporal network coding of physiological mossy fiber inputs by the cerebellar granular layer

Affiliations

Spatiotemporal network coding of physiological mossy fiber inputs by the cerebellar granular layer

Shyam Kumar Sudhakar et al. PLoS Comput Biol. .

Erratum in

Abstract

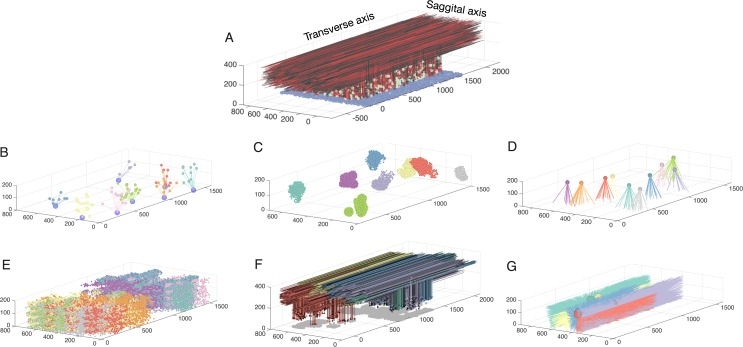
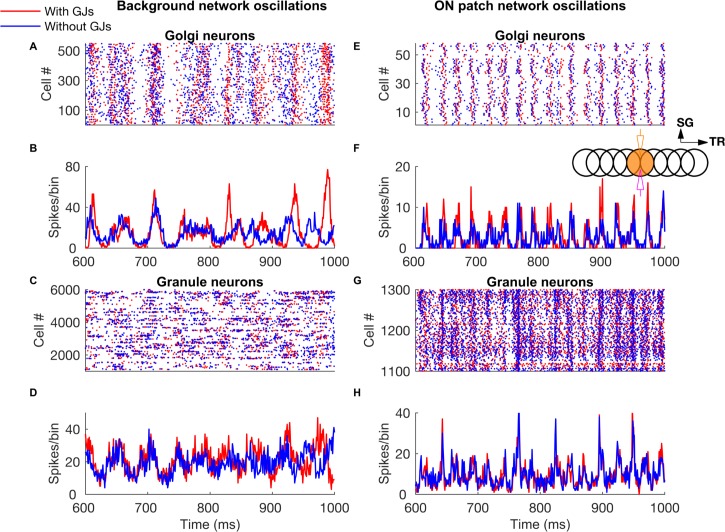
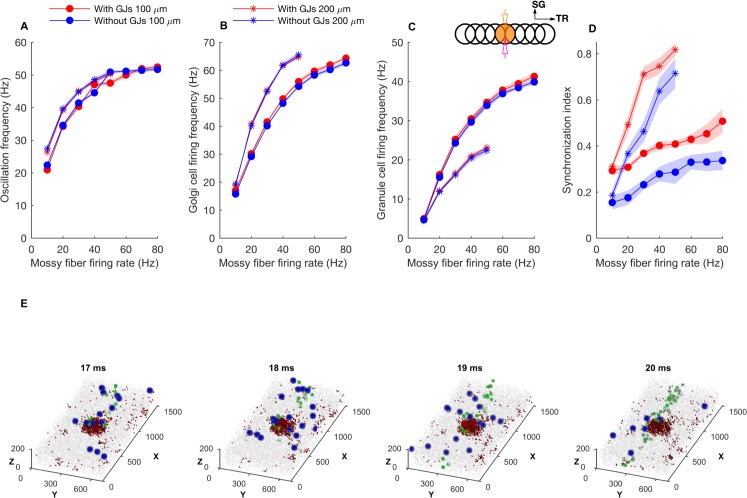
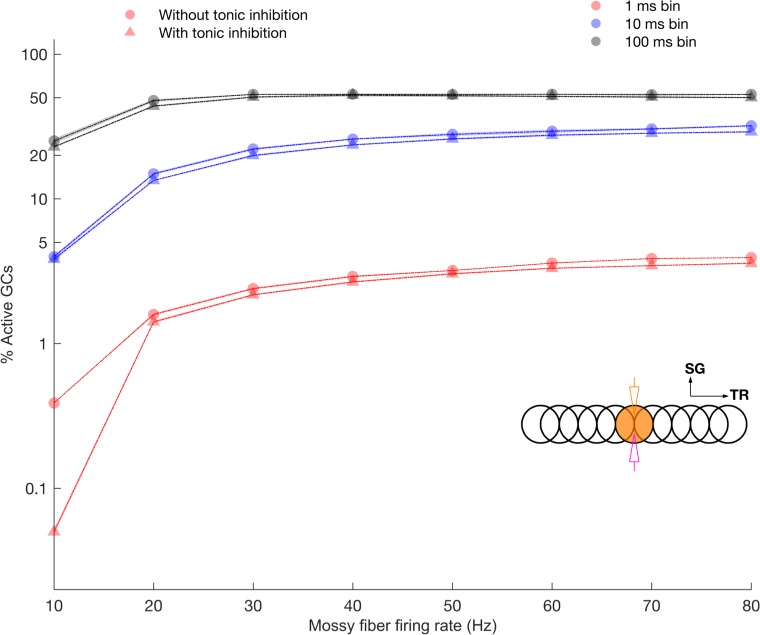
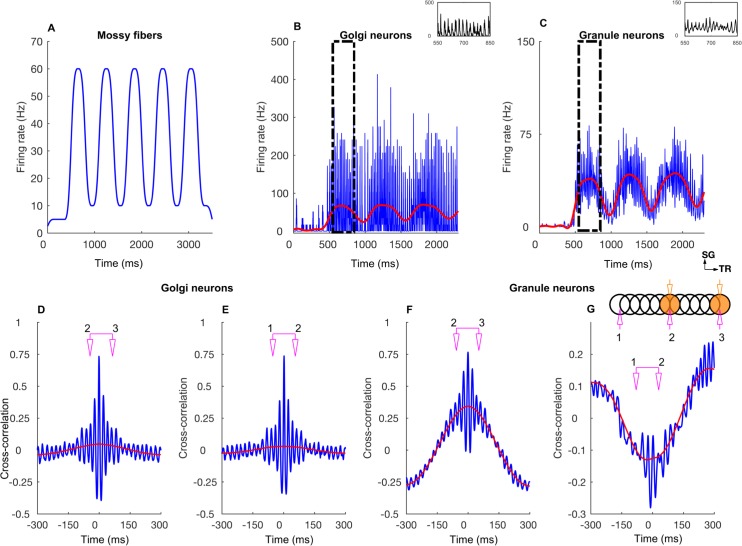
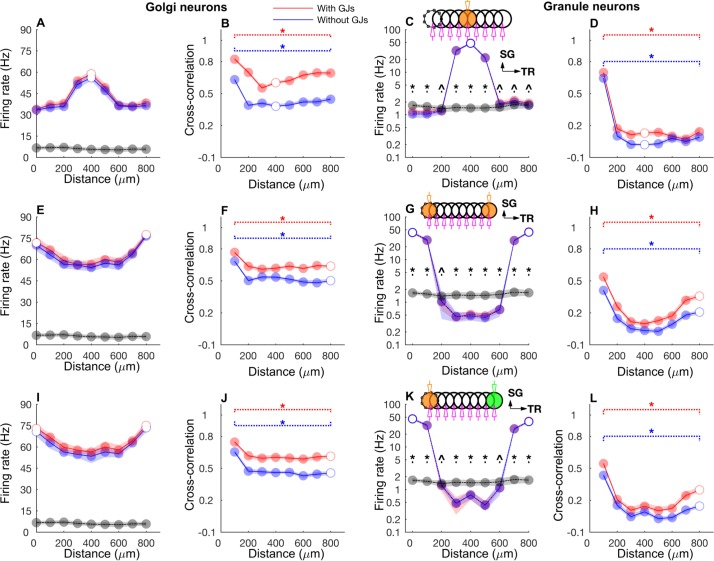
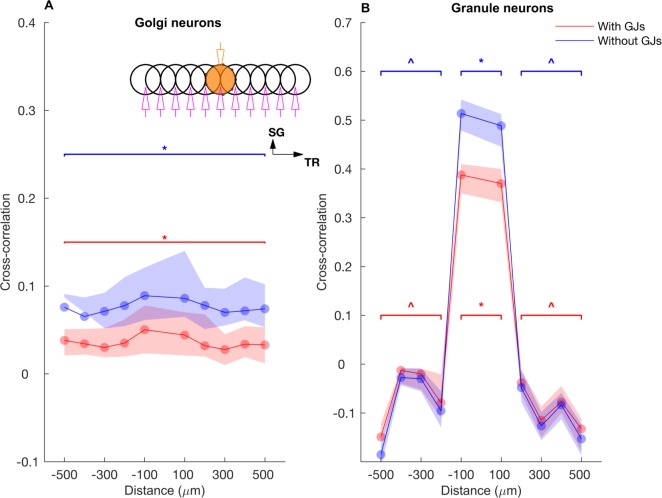
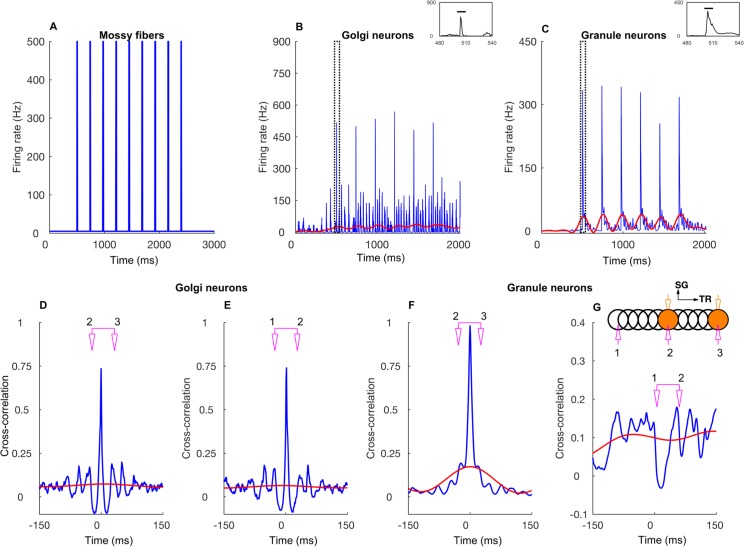
The granular layer, which mainly consists of granule and Golgi cells, is the first stage of the cerebellar cortex and processes spatiotemporal information transmitted by mossy fiber inputs with a wide variety of firing patterns. To study its dynamics at multiple time scales in response to inputs approximating real spatiotemporal patterns, we constructed a large-scale 3D network model of the granular layer. Patterned mossy fiber activity induces rhythmic Golgi cell activity that is synchronized by shared parallel fiber input and by gap junctions. This leads to long distance synchrony of Golgi cells along the transverse axis, powerfully regulating granule cell firing by imposing inhibition during a specific time window. The essential network mechanisms, including tunable Golgi cell oscillations, on-beam inhibition and NMDA receptors causing first winner keeps winning of granule cells, illustrate how fundamental properties of the granule layer operate in tandem to produce (1) well timed and spatially bound output, (2) a wide dynamic range of granule cell firing and (3) transient and coherent gating oscillations. These results substantially enrich our understanding of granule cell layer processing, which seems to promote spatial group selection of granule cell activity as a function of timing of mossy fiber input.


Conflict of interest statement

The authors have declared that no competing interests exist.

Figures

Fig 1
Fig 1. Network connectivity for all populations in the granule layer model.
A: The completely assembled network showing 10% of all GrCs and parallel fibers (red shades), along with all GoCs (green) and all mossy fibers locations (blue). The following panels always show subsets of model elements to demonstrate their specific connectivity. B: Example of 7 mossy fibers diverging onto GoCs. C: The GrCs contacted by 8 different mossy fibers through rosettes (color coded by mossy fiber identity). D: Mossy fibers converging onto different GoCs (one color per Golgi cell). E.: GrCs inhibited by different Golgi cells (each color represents one Golgi cell). F: Ascending axons and parallel fibers relating to 5 different mossy fibers (each color represents one mossy fiber) G: Parallel fibers from granule cells, which converge onto different GoCs (each color represents one Golgi cell).
Fig 2
Fig 2. Network-wide oscillations with mossy fiber inputs.
A-D: GoC and GrC activity in the presence of 5 Hz background mossy fiber input. A and B represent GoC population raster plot and population spike timing histogram, respectively. C and D are the same type of plots as A and B for the GrC population. E-H: GoC and GrC activity when mossy fibers within a patch (a red circle in Fig 1) are activated at 60 Hz in addition to the 5 Hz mossy fiber activation of the rest of the network. E, F: GoC raster plot and population spike timing histogram. G, H: the same plots for the GrCs. The inset represents stimulation and recording configuration used for E-H. An orange and empty region represents the stimulated (ON) and unstimulated (OFF) patch, respectively. Electrodes represent stimulation (orange) and recording (magenta), respectively. TR: Transverse. SG: Sagittal.
Fig 3
Fig 3. Oscillation frequency and firing rates for patch activation with different input firing frequencies.
A: network mean oscillation frequency versus average mossy fiber firing rate versus for 100 and 200 μm ON patch radius, with and without gap junctions. B, C, D: Same as A for mean GoC firing rate, mean GrC firing rate, network synchronization index, respectively. Membrane potentials of example neurons are shown in S1A–S1D Fig. With the 200 μm patch radius, mossy fiber firing rates above 50 Hz caused depolarization block of GoCs and this data was discarded. E: Volumetric maps representing network activity at different times during a 60Hz patch stimulus. Full sequence is available in S1 Movie. The blue and green dots represent mossy fiber and GoC activity respectively, while gray dots represent non-spiking neurons. The small red points are active GrCs. Notice, from left to right, the activations of mossy fibers in the central patch, leading to increased GrC activity in the patch and followed by activation of a beam of GoCs. The inset in C represents the same configuration as the one in Fig 2. Data are mean±standard deviation.
Fig 4
Fig 4. Dynamic range of GrC activation quantified for ON and OFF patches in response to varying mossy fiber firing rate.
Percentage of active GrCs computed with different time windows for ON patch in the presence and absence of tonic inhibition.
Fig 5
Fig 5. Network response to slow rate modulated mossy fiber inputs activated in two patches along the transverse axis.
A: Average mossy fiber firing rate in the ON patches, alternating between 10 and 60 Hz. B: Average GoC firing rate within the ON patches. The inset is a zoomed view of the boxed region. The blue trace represents the firing rate computed with a 1 ms time bin. The red trace is obtained by low-pass filtering (< 10 Hz) the blue trace. Membrane potentials of example cells are shown in S1E and S1F Fig. C: Same as B for GrCs. Membrane potentials of example cells are shown in S1G and S1H Fig. D: Cross-correlation function (CCF) between GoC firings in two ON patches separated by 500 μm along the transverse axis. The blue and red curves represent which data the CCF is computed from and follows the same scheme as B and C. The scheme in pink refers to the recording electrode setup shown in the inset of G. E: CCF between GoC firings in an ON and OFF patch separated by 500 μm along the transverse axis. Same color conventions. F, G: Same as D and E for GrCs, respectively. The stimulation and recording configuration shown as inset in G follows the same scheme as the one in Fig 2.
Fig 6
Fig 6. Firing rate and cross-correlations along the transverse axis.
A-D: GoC firing rate (A), cross-correlation (B), GrC firing rate (C), cross-correlation (D) along the transverse axis when the network was activated with a single patch of mossy fibers with slow rate coded input. Black lines and gray dots represent background network firing rate for the respective patches. Where red (simulations with gap junctions) and blue data (without gap junctions) overlap perfectly, the colors are added resulting in purple. Broken lines in B and C indicate significant correlation throughout the entire range of the data. E-H: Same as A-D for the network activated with mossy fibers in two ON patches separated by 800 μm along the transverse axis. The same rate modulation was used for mossy fiber inputs in both patches. I-L: Same as E-H, while rate modulation in one of the patches followed the same time course but had different a peak rate of 50 Hz which is marked by green color in the inset in K. Asterisk and triangle represent significant (p<0.01) and insignificant correlation (p> = 0.01), respectively in B, D, F, H, J and L. Similar symbols were used to show the results of two tailed t-tests comparing activity in each patch between patch activation and background activation data in C, G and K. The stimulation and recording configuration shown as inset in C, G, and K follow the same scheme as those in Fig 2. Beaded circle represents the reference patch with which the correlation of every other patch is computed. Data are mean±standard deviation.
Fig 7
Fig 7. Correlation of slow rate change along the transverse axis.
A, B: Cross-correlation of long term firing rates for GoCs and GrCs along the transverse axis with the ON patch as a reference (beaded patch). Cross-correlation was computed based on low-pass filtered (< 10 Hz) spike trains. Note that the firing rate correlation is higher in the absence of gap junctions due to a higher amplitude in rate fluctuations with gap junctions (see Methods). Asterisk and triangle represent significant (p<0.01) and insignificant correlation (p> = 0.01), respectively. The stimulation and recording configuration shown as insets in B follows the same scheme as in Fig 6. Data are mean±standard deviation.
Fig 8
Fig 8. Ascending axon inputs mediate desynchronization of GoCs along the transverse axis.
A: Cross-correlation of GoCs along the transverse axis for single patch (blue) and double patch activation (black). B: Same as A where temporal structure difference of mossy fiber inputs between two ON patches is removed in the double patch activation. C: Same as A with ascending axon inputs to GoCs removed. The red box in all the panels indicates the data of interest in the respective curves: the cross-correlation with the remote patch. The stimulation and recording configuration shown as inset in C represents the same configuration as in Fig 6.
Fig 9
Fig 9. Network response to bursting mossy fiber inputs in two patches along the transverse axis.
A: Average mossy fiber firing rate in the ON patch. B: Average GoC firing rate within the ON patch. The inset is a zoomed view of the boxed region. The blue trace represents the firing rate computed with a 1 ms time bin. The red trace is obtained by low-pass filtering (< 10 Hz) of the blue trace. Membrane potentials of example cells are shown in S1I and S1J Fig. C: Same as B for GrC. Membrane potentials of example cells are shown in S1K and S1L Fig. D: CCF between GoC firings in two ON patches separated by 500 μm along the transverse axis. The color represents which data the CCF is computed from and follows the same scheme as B and C. E: CCF between GoC firings in an ON and OFF patch separated by 500 μm along the transverse axis. F, G: Same as D and E for GrCs, respectively. The stimulation and recording configuration shown as inset in K represents the same configuration as the one in Fig 2.
Fig 10
Fig 10. Firing rate and cross-correlation along the transverse axis with bursting mossy fiber inputs.
A-D: GoC firing rate (A), cross-correlation (B), GrC firing rate (C), cross-correlation (D) along the transverse axis when the network was activated with a single patch of bursting mossy fiber inputs. E-H: Same as A-D for the network activated with bursting mossy fiber input in two ON patches separated by 800 μm along the transverse axis. Same color and symbol conventions as in Fig 6.
Fig 11
Fig 11. Feedback inhibition reduces delayed bursting of GrCs.
Average GrC firing rate within the patch versus latency of the second ON patch mossy fiber burst. Two patches of mossy fibers were activated along the transverse axis and GrCs were recorded in the patch with delayed mossy fiber activation. The stimulation and recording configuration shown as inset follows the same scheme as in Fig 2.
Fig 12
Fig 12. NMDA receptors mediate long-term gain increase in ON patch GrCs.
A: Burst triggered average firing rate of the ON patch GrCs with normal or reduced conductance of NMDA receptors. Results shown in the absence of probe input. Time zero corresponds to the end of the mossy fiber burst. Inset represents membrane potential traces of representative ON patch GrCs in response to bursting mossy fiber input. Scale bar: x-axis = 3 ms, y-axis = 15 mV. B: Raster plot of firing of GrCs in ON (red) and OFF patch (blue) in the absence of probe input. C: Same as B, with conductance of NMDA receptors reduced by 75%. D: Schematic representations of the burst input and probe input. The probe input is presented ‘T’ ms after the burst offset. E: Mean firing rate of ON patch and OFF patch GrC population during the asynchronous probe input versus time after the burst offset. Firing rates without a probe input and a prediction assuming no gain change are also shown for comparison. F: Mean firing rate of ON patch and OFF patch GrC population with normal and with reduced NMDA conductance during the probe input versus probe input onset time after the burst offset. In A, B, and C, solid line represent burst duration. The inset in B and D represents the stimulation and recording configurations in the same way as in Fig 9 while green color here represents the probe input.
Fig 13
Fig 13. Effect of GrC tonic inhibition on the power and frequency of network oscillations.
A: Power spectral density of oscillations in firings of ON patch GoCs upon 30 Hz mossy fiber inputs with and without tonic inhibition. B: Same as A for 40 Hz mossy fiber inputs. C: Oscillation frequency versus ON patch mossy fiber firing rate with and without tonic inhibition. D: Peak oscillation power versus ON patch mossy fiber firing rate with and without tonic inhibition. The inset in B represents the same stimulation and recording configuration as in Fig 2. Data are mean±standard deviation.

Similar articles

Cited by

References

    1. Palay SL, Chan-Palay V. Cerebellar Cortex Berlin, Heidelberg: Springer Berlin; Heidelberg; 1974. doi: 10.1007/978-3-642-65581-4 - DOI
    1. Melik-Musyan AB, Fanardzhyan V V. Morphological characteristics of Lugaro cells in the cerebellar cortex. Neurosci Behav Physiol. 2004;34: 633–638. doi: 10.1023/B:NEAB.0000028297.30474.f9 - DOI - PubMed
    1. Diño MR, Schuerger RJ, Liu YB, Slater NT, Mugnaini E. Unipolar brush cell: A potential feedforward excitatory interneuron of the cerebellum. Neuroscience. 2000;98: 625–636. doi: 10.1016/S0306-4522(00)00123-8 - DOI - PubMed
    1. Korbo L, Andersen BB, Ladefoged O, Møller a. Total numbers of various cell types in rat cerebellar cortex estimated using an unbiased stereological method. Brain Res. 1993;609: 262–268. doi: 10.1016/0006-8993(93)90881-M - DOI - PubMed
    1. Barmack NH, Yakhnitsa V. Functions of interneurons in mouse cerebellum. J Neurosci. 2008;28: 1140–52. doi: 10.1523/JNEUROSCI.3942-07.2008 - DOI - PMC - PubMed

LinkOut - more resources