. 2017 Sep 21;12(9):e0184497.
doi: 10.1371/journal.pone.0184497. eCollection 2017.

Endogenous RGS14 is a cytoplasmic-nuclear shuttling protein that localizes to juxtanuclear membranes and chromatin-rich regions of the nucleus

Affiliations

Endogenous RGS14 is a cytoplasmic-nuclear shuttling protein that localizes to juxtanuclear membranes and chromatin-rich regions of the nucleus

Mary Rose Branch et al. PLoS One. .

Abstract

Regulator of G protein signaling 14 (RGS14) is a multifunctional scaffolding protein that integrates G protein and H-Ras/MAPkinase signaling pathways to regulate synaptic plasticity important for hippocampal learning and memory. However, to date, little is known about the subcellular distribution and roles of endogenous RGS14 in a neuronal cell line. Most of what is known about RGS14 cellular behavior is based on studies of tagged, recombinant RGS14 ectopically overexpressed in unnatural host cells. Here, we report for the first time a comprehensive assessment of the subcellular distribution and dynamic localization of endogenous RGS14 in rat B35 neuroblastoma cells. Using confocal imaging and 3D-structured illumination microscopy, we find that endogenous RGS14 localizes to subcellular compartments not previously recognized in studies of recombinant RGS14. RGS14 localization was observed most notably at juxtanuclear membranes encircling the nucleus, at nuclear pore complexes (NPC) on both sides of the nuclear envelope and within intranuclear membrane channels, and within both chromatin-poor and chromatin-rich regions of the nucleus in a cell cycle-dependent manner. In addition, a subset of nuclear RGS14 localized adjacent to active RNA polymerase II. Endogenous RGS14 was absent from the plasma membrane in resting cells; however, the protein could be trafficked to the plasma membrane from juxtanuclear membranes in endosomes derived from ER/Golgi, following constitutive activation of endogenous RGS14 G protein binding partners using AlF4¯. Finally, our findings show that endogenous RGS14 behaves as a cytoplasmic-nuclear shuttling protein confirming what has been shown previously for recombinant RGS14. Taken together, the findings highlight possible cellular roles for RGS14 not previously recognized that are distinct from the regulation of conventional GPCR-G protein signaling, in particular undefined roles for RGS14 in the nucleus.


Conflict of interest statement

Competing Interests: The authors have declared that no competing interests exist.

Figures

Fig 1
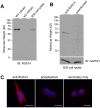
Fig 1. RGS14 polyclonal antibody specifically recognizes endogenous RGS14 in mouse brain and B35 neuroblastoma cells.
(A) The presence of endogenous RGS14 in brain from wild type (WT) and RGS14 knockout (KO) mice, and B35 rat neuroblastoma cells was analyzed by SDS-PAGE and immunoblotting with an RGS14 polyclonal antibody. (B) Equivalent amounts of B35 cell lysate were resolved by SDS–PAGE and transferred to nitrocellulose membranes. Membranes were probed with an RGS14 antibody or RGS14 antibody pre-adsorbed with five-fold excess (ng protein) purified full-length rat RGS14. (C) Confocal images of B35 cells immunostained with an RGS14 antibody, RGS14 antibody pre-adsorbed with five-fold excess purified full-length RGS14, or no primary antibody (secondary only) followed by Alexa 594 secondary antibody (red). Nuclei were counterstained with Hoechst (blue). Scale bar, 10 μm. All images were acquired and processed using identical settings. Cells shown are representative of approximately 600 cells observed from 40 fields of view across three independent experiments.
Fig 2
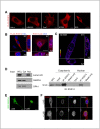
Fig 2. Endogenous RGS14 is enriched at juxtanuclear membranes and shuttles between the cytoplasm and nucleus in B35 cells.
(A) FLAG-RGS14 predominantly localizes to the cytoplasm under basal conditions when expressed in various cell lines. HeLa, HEK293, Cos7, SF295, and B35 cells were transfected with 250–500 ng of FLAG-RGS14 cDNA, immunostained with a FLAG antibody and visualized by confocal microscopy. Scale bar, 10 μm. (B) Optical mid-section (XY) and orthogonal views (XZ, YZ) of representative confocal z stacks of B35 cells expressing exogenous FLAG-RGS14 immunostained with a FLAG antibody (left) or endogenous RGS14 immunostained with an RGS14 polyclonal antibody (RGS14 pAb, right). DNA was visualized with Hoechst counterstain (blue). While exogenously expressed FLAG-RGS14 localizes to the cytoplasm, endogenous RGS14 appears to localize to various subcellular compartments, including cytoplasmic puncta, nuclear periphery, nuclear matrix, and nuclear foci. (C) Optical mid-section (XY) and orthogonal views (XZ, YZ) of a z-stack acquired using 3D-Structured Illumination Microscopy (3D-SIM) of a B35 cell immunostained with RGS14 pAb. Image shows a heat map of pixel intensity (‘Fire’ LUT, ImageJ). (D) Cellular fractionation of B35 cells into cytoplasmic and nuclear fractions. To assess fractionation purity (Left), whole cell lysate (WCL) and equal volumes of cytoplasmic (Cyt) and nuclear (Nuc) fractions were probed with antibodies against Lamin A/C (nuclear membrane), GAPDH (soluble cytosol), and OPA1 (mitochondria). Immunoprecipitation of endogenous RGS14 from both cytoplasmic and nuclear fractions (Right) confirms native RGS14 localizes to both the cytoplasm and nucleus. Cytoplasmic and nuclear fractions were prepared using equivalent volumes of buffer and used for immunoprecipitation (IP) of RGS14. Input represents 10% of IP sample volume. Both exogenous GFP-RGS14 (E) and endogenous RGS14 (F) accumulate in the nucleus in the presence of the inhibitor of CRM1-dependent nuclear export, leptomycin B (LMB). Untransfected B35 cells or cells transfected with GFP-RGS14 were incubated with 20 nM of LMB or ethanol control for 3 hours. (E) Representative maximum intensity projections of confocal z-stacks of B35 cells expressing GFP-RGS14 incubated with ethanol control (-LMB) or 20 nM of LMB (+LMB) for 3 hours. (F) Representative confocal image (optical mid section) of an untransfected B35 cells immunostained with RGS14 pAb (red) and anti-Lamin A/C (green) to outline the nuclear membrane, and counterstained with Hoechst (blue) to visualize the nucleus.. Cells shown are representative of approximately 600 cells observed from 40 fields of view across 3 independent experiments.
Fig 3
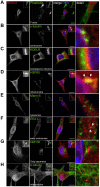
Fig 3. Endogenous RGS14 is enriched as puncta at various cytosolic compartments of B35 cells.
B35 cells were fixed and co-stained with RGS14 polyclonal antibody (red) and one of several organelle markers (green): (A) Rhodamine phalloidin, F-actin; (B) γ-tubulin, centrosomes; (C) endoplasmic reticulum, KDELR; (D) HSP60, mitochondria; (E) lysosomes; (F) Mann-6; EEA1, early endosomes; (G) GM130, Golgi apparatus; (H) α-tubulin, microtubules. Nuclei were counterstained with Hoechst (blue). For B35 cells co-stained with rhodamine phalloidin to label F-actin (A) and antibody against mitochondrial marker HSP60 (D), cells were fixed with 4% paraformaldehyde in 1X PBS and permeabilized in 0.1% Triton-X. B35 cells co-stained with all other organelles were fixed with 4% PFA in PHEM cytoskeleton stabilizing buffer and permeabilized with methanol. Insets represent magnified boxed regions (2x magnification), and are enlarged to the right of the merged image (detail). Scale bar, 10 μm. White arrowheads point to regions of endogenous RGS14 colocalization with mitochondrial marker HSP60 (D) and early endosome marker EEA1 (F). Cells shown are representative of approximately 600 cells observed from 40 fields of view across 3 independent experiments.
Fig 4
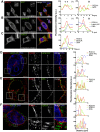
Fig 4. RGS14 localizes to both the cytoplasmic and nuclear sides of the nuclear envelope in B35 cells.
B35 cells were immunostained for endogenous RGS14 (red) and nuclear pore complex proteins (NPC), nuclear membrane (Lamin A/C), or endoplasmic reticulum (KDELR) shown in green. Cells were counterstained with Hoechst to show DNA (blue). Optical mid sections were obtained by confocal microscopy (A-C; scale bar, 10 μm) or 3D-SIM (D-F; scale bar, 2 μm). (A-C) Insets in confocal images represent magnified boxed regions (2x magnification). (D-F) Boxed regions in 3D-SIM images are shown to the right at a 2X magnification. Graphs show fluorescence intensity (arbitrary units; a.u.) for each channel across the dotted white lines in the direction of the arrow in the merged images. RGS14 and nuclear pore complex proteins mainly localize in alternating puncta along the nuclear periphery (A, E). RGS14 localizes to both the cytoplasmic (gray asterisk) and nuclear (black asterisk) sides of the nuclear membrane (B, D), and between the endoplasmic reticulum and nucleus (C, F). Dotted gray line in graph 2 in B traces peak Lamin A/C fluorescence intensity to highlight that peak RGS14 fluorescence resides on the nuclear side of the nuclear membrane. Arrow heads indicate regions of apparent colocalization between RGS14 and the nuclear pore complex by confocal microscopy (A) or nuclear membrane by 3D-SIM (D). Cells shown are representative of approximately 600 cells observed from 40 fields of view across 3 independent experiments for confocal images and 50–75 cells for 3D-SIM images. Note that the same set of coverslips used to obtain confocal images were also used to obtain 3D-SIM images.
Fig 5
Fig 5. Endogenous RGS14 localizes to intranuclear channels enriched with nuclear pore complexes (NPC).
Z-projection (A) and optical mid section (B) obtained with 3D-SIM of a B35 cell nucleus immunostained for endogenous RGS14 (red) and nuclear pore complex proteins (NPC; green). (C, D) Orthogonal views marked by the dotted white lines in B (XY-projection). White arrowheads in A and B point to the location of a DNA-poor intranuclear channel enriched with RGS14 and nuclear pore complex proteins (enlarged to the right or bottom of C and D, respectively). Note that RGS14 and nuclear pore complex proteins are localized to the same transnuclear channel, but do not co-localize. Cells shown are representative of approximately 75 cells observed across 3 independent experiments.
Fig 6
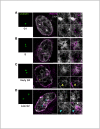
Fig 6. Endogenous RGS14 localizes to chromatin-rich compartments in close proximity with RNA polymerase II in the nucleus of B35 cells.
Representative 3D-SIM images of the different types of RGS14 distributions observed in B35 cell nuclei. (A, B) B35 cell nuclei counterstained with Hoechst (white/gray) and immunostained with an anti-RGS14 polyclonal antibody (red). (A) Higher magnification images of boxed regions in the XY-projection (top left) are shown to the right. Bottom row shows orthogonal views marked by the dotted white lines in the XY-projection in the indicated planes (1, XZ; 2, YZ). Yellow arrowheads point to an area of enriched RGS14 staining located within a region of high intensity Hoechst-stained chromatin (chromocenter). Cyan arrows indicate enriched RGS14 staining within a DNA-poor intranuclear channel/tubule. Scale bar, 2 μm. (B) Optical mid section (XY-projection) of a B35 cell nucleus with RGS14 puncta enriched at the periphery of a DNA-rich chromocenter at a nuclear invagination. Higher magnification image of boxed region is shown to the right. Scale bar, 2 μm. (C) Optical mid section of a B35 cell nucleus counterstained with Hoechst (gray) and immunostained with an anti-RGS14 polyclonal antibody (red) and mAb H5 (green), which recognizes the 3′ end of active RNA Polymerase II (Ser2P RNA Pol II). Higher magnification image of boxed region is shown to the right. A subpopulation of RGS14 nuclear puncta colocalize with active RNA Polymerase II (Ser2P RNA Pol II) foci (white arrowheads). Scale bar, 2 μm. Orthogonal views YZ (D) and XZ (E) show RGS14 immunostaining wrapping around Ser2P RNA Pol II foci and spanning across a DNA-poor interchromatin compartment to connect two DNA-rich chromocenters. Scale bar, 1 μm. Graphs show fluorescence intensity (arbitrary units; a.u.) for each channel across the dotted white lines in the direction of the arrow in D and E. Cells shown are representative of approximately 75 cells observed across 3 independent experiments.
Fig 7
Fig 7. The distribution of endogenous RGS14 in the nucleus is cell cycle-dependent.
(A-D) Representative 3D-SIM images of B35 cell nuclei synchronized at different stages of the cell cycle. Cells were synchronized at G1/S using a double thymidine block, fixed at different time points following release (as described in Material and Methods), and immunostained for endogenous RGS14 (magenta) and centrosome marker γ-tubulin (green), to confirm cell cycle stag, and counterstained with Hoechst (gray). Scale bar, 2 μm. In some cases, centrosomes did not lie in the same XY-plane as optimal mid sections through the nuclei and are thus shown in boxes to the left of each corresponding nucleus. Boxed regions are magnified and shown in numbered panels to the right. Representative images in G1, showing RGS14 puncta in the nucleus clustered along the periphery of regions of high intensity Hoechst-stained chromatin (chromocenter; A1) and are largely absent in dark DNA-poor interchromatin compartments (A2). In S and early G2, RGS14 puncta mainly localize within DNA-rich chromocenters (B1, C1) and along peripheral heterochromatin (C2, yellow arrow), and remain absent in DNA-poor interchromatin compartments (B2, C2). Representative images showing the disappearance of RGS14 puncta within medium-intensity chromatin territories (D1) during late G2/M as cells condense their nuclear genome while progressing into mitosis; instead, RGS14 puncta are concentrated within the two most highly compact chromocenters (D2, cyan arrows). Cells shown for each stage are representative of approximately 50–75 cells observed across 3 independent experiments.
Fig 8
Fig 8. Activation of endogenous G proteins with AlF4¯ induces translocation of endogenous RGS14 from juxtanuclear membranes to cytosolic puncta and the plasma membrane.
Confocal microscopy analysis (A, C, D) and quantification (B) of endogenous RGS14 translocation from the nuclear membrane after activation of endogenous G proteins with AlF4¯. A significant decrease in endogenous RGS14 localization around the nuclear membrane of B35 cells was observed 10 min after global G protein activation with AlF4¯. (A) Confocal images of B35 cells incubated with or without (control) AlF4¯ for indicated times and stained with an anti-RGS14 polyclonal antibody. Boxed regions are enlarged in the insets. (B) Representative confocal image of an untreated (control) B35 cell stained with the RGS14 polyclonal antibody (red) and counterstained with Hoechst DNA dye (blue) (left column). Right column shows the same cell with lines drawn around the nuclear membrane (white) and cytosol (gray) as described in Materials and Methods. Total fluorescence intensity was measured within the ring around the periphery of the nucleus (bounded by the white lines) and a comparable sized area within the cytosol (bounded by the gray lines) using ImageJ software. Scatterplot shows the ratio of nuclear membrane-to-cytosol localization of endogenous RGS14 in B35 cells following treatment with and without 10 min of AlF4¯ -induced G protein activation. Nuclear membrane-to-cytosol localization of RGS14 was determined by dividing the average fluorescence intensity (total fluorescence/area) around the nuclear membrane (Nuc Mem) by the average fluorescence intensity of a comparable area in the cytosol (Cyt) as described in Materials and Methods. Each point on the scatter plot represents the Nuc Mem/Cyt fluorescence intensity for a single cell immunostained with an RGS14 antibody and counterstained with Hoechst DNA dye to locate nuclei (n = 35 cells for each experimental condition, 3 independent experiments). Horizontal line shows mean Nuc Mem/Cyt intensity ratio. ****P<0.0001 (Student t-test). (C) Localization of endogenous RGS14 increased within clusters around the trans-Golgi network (anti-TGN38) and Golgi (anti- GM130) after G protein activation with AlF4¯ for 10 min, and (D) and at the plasma membrane in some cells after 15 min. Graphs (D) show fluorescence intensity (arbitrary units; a.u.) of RGS14 along the white lines in the above images. Scale bar, 10 μm in all cases.

Similar articles

Cited by

References

    1. Hepler JR, Gilman AG (1992) G proteins. Trends Biochem Sci 17: 383–387. doi: 10.1016/0968-0004(92)90005-T - DOI - PubMed
    1. Hamm HE (1998) The many faces of G protein signaling. J Biol Chem 273: 669–672. doi: 10.1074/jbc.273.2.669 - DOI - PubMed
    1. Hollinger S, Hepler JR (2002) Cellular regulation of RGS proteins: modulators and integrators of G protein signaling. Pharmacol Rev 54: 527–559. doi: 10.1124/pr.54.3.527 - DOI - PubMed
    1. Shu F, Ramineni S, Hepler JR (2010) RGS14 is a multifunctional scaffold that integrates G protein and Ras/Raf MAPkinase signalling pathways. Cell Signal 22: 366–376. doi: 10.1016/j.cellsig.2009.10.005 - DOI - PMC - PubMed
    1. Vellano CP, Brown NE, Blumer JB, Hepler JR (2013) Assembly and function of the regulator of G protein signaling 14 (RGS14)·H-Ras signaling complex in live cells are regulated by Gαi1 and Gαi-linked G protein-coupled receptors. J Biol Chem 288: 3620–3631. doi: 10.1074/jbc.M112.440057 - DOI - PMC - PubMed

MeSH terms