

Reducing cell wall feruloylation by expression of a fungal ferulic acid esterase in Festuca arundinacea modifies plant growth, leaf morphology and the turnover of cell wall arabinoxylans
- PMID: 28934356
- PMCID: PMC5608373
- DOI: 10.1371/journal.pone.0185312
Reducing cell wall feruloylation by expression of a fungal ferulic acid esterase in Festuca arundinacea modifies plant growth, leaf morphology and the turnover of cell wall arabinoxylans
Abstract
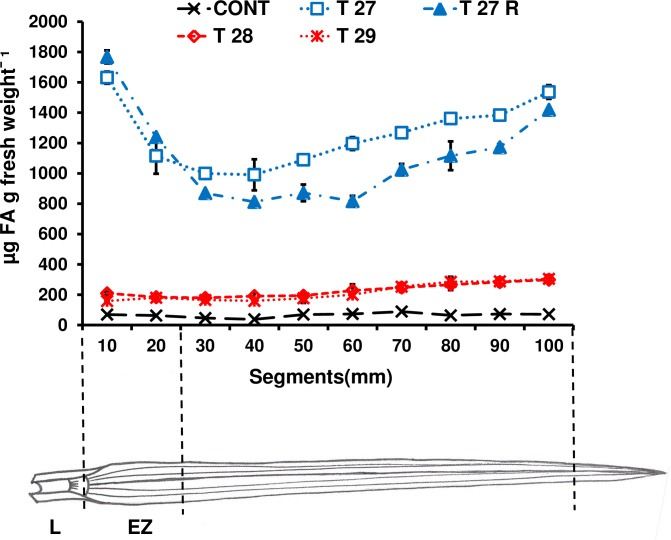
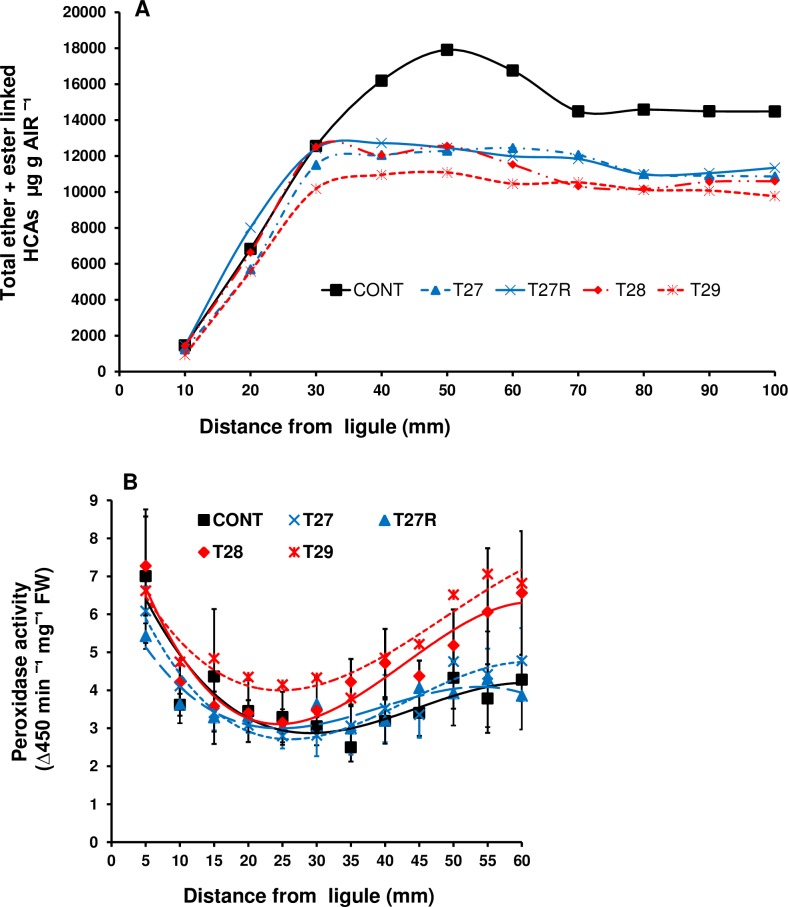
A feature of cell wall arabinoxylan in grasses is the presence of ferulic acid which upon oxidative coupling by the action of peroxidases forms diferuloyl bridges between formerly separated arabinoxylans. Ferulate cross-linking is suspected of playing various roles in different plant processes. Here we investigate the role of cell wall feruloyaltion in two major processes, that of leaf growth and the turnover of cell wall arabinoxylans on leaf senescence in tall fescue using plants in which the level of cell wall ferulates has been reduced by targeted expression of the Aspergillus niger ferulic acid esterase A (FAEA) to the apoplast or Golgi. Analysis of FAE expressing plants showed that all the lines had shorter and narrower leaves compared to control, which may be a consequence of the overall growth rate being lower and occurring earlier in FAE expressing leaves than in controls. Furthermore, the final length of epidermal cells was shorter than controls, indicating that their expansion was curtailed earlier than in control leaves. This may be due to the observations that the deposition of both ether and ester linked monomeric hydroxycinnamic acids and ferulate dimerization stopped earlier in FAE expressing leaves but at a lower level than controls, and hydroxycinnamic acid deposition started to slow down when peroxidase levels increased. It would appear therefore that one of the possible mechanisms for controlling overall leaf morphology such as leaf length and width in grasses, where leaf morphology is highly variable between species, may be the timing of hydroxycinnamic acid deposition in the expanding cell walls as they emerge from cell division into the elongation zone, controlled partially by the onset of peroxidase activity in this region.
Conflict of interest statement
Figures


Similar articles
-
Probing the role of cell wall feruloylation during maize development by differential expression of an apoplast targeted fungal ferulic acid esterase.PLoS One. 2020 Oct 9;15(10):e0240369. doi: 10.1371/journal.pone.0240369. eCollection 2020. PLoS One. 2020. PMID: 33035255 Free PMC article.
-
Targeting expression of a fungal ferulic acid esterase to the apoplast, endoplasmic reticulum or golgi can disrupt feruloylation of the growing cell wall and increase the biodegradability of tall fescue (Festuca arundinacea).Plant Biotechnol J. 2010 Apr;8(3):316-31. doi: 10.1111/j.1467-7652.2009.00485.x. Epub 2010 Jan 19. Plant Biotechnol J. 2010. PMID: 20102533
-
Functional co-expression of a fungal ferulic acid esterase and a β-1,4 endoxylanase in Festuca arundinacea (tall fescue) modifies post-harvest cell wall deconstruction.Planta. 2015 Jul;242(1):97-111. doi: 10.1007/s00425-015-2288-2. Epub 2015 Apr 9. Planta. 2015. PMID: 25854601
-
Feruloylation in grasses: current and future perspectives.Mol Plant. 2009 Sep;2(5):861-72. doi: 10.1093/mp/ssp067. Epub 2009 Aug 24. Mol Plant. 2009. PMID: 19825663 Review.
-
Biotechnological applications and potential of fungal feruloyl esterases based on prevalence, classification and biochemical diversity.Biotechnol Lett. 2008 Mar;30(3):387-96. doi: 10.1007/s10529-007-9564-6. Epub 2007 Nov 1. Biotechnol Lett. 2008. PMID: 17973091 Review.
Cited by
-
Late-stage changes in the composition of cell walls of maize plants expressing an apoplast targeted, senescence enhanced fungal ferulic acid esterase, and the subsequent effects on tissue saccharification.PLoS One. 2025 Jan 3;20(1):e0315950. doi: 10.1371/journal.pone.0315950. eCollection 2025. PLoS One. 2025. PMID: 39752449 Free PMC article.
-
Engineering grass biomass for sustainable and enhanced bioethanol production.Planta. 2019 Aug;250(2):395-412. doi: 10.1007/s00425-019-03218-y. Epub 2019 Jun 24. Planta. 2019. PMID: 31236698 Review.
-
Characterization of feruloyl esterases in maize pollen.Planta. 2019 Dec;250(6):2063-2082. doi: 10.1007/s00425-019-03288-y. Epub 2019 Oct 1. Planta. 2019. PMID: 31576447
-
Probing the role of cell wall feruloylation during maize development by differential expression of an apoplast targeted fungal ferulic acid esterase.PLoS One. 2020 Oct 9;15(10):e0240369. doi: 10.1371/journal.pone.0240369. eCollection 2020. PLoS One. 2020. PMID: 33035255 Free PMC article.
References
-
- Brett CT, Waldron K. Cell wall formation In: Brett T, Waldron K, editors. Physiology and biochemistry of plant cell walls. Chapman & Hall: London; 1996. pp. 75–111.
-
- Carpita NC, Mccann MC (2000). The cell wall In: Buchanan BB, Gruissem W, Jones RL, editors. Biochemistry and Molecular Biology of Plants. Rockville, MD: American Society of Plant Biologists; 2000. pp 52–108.
-
- Hückelhoven R. Cell wall-associated mechanisms of disease resistance and susceptibility. Annu Rev Phytop. 2007; 45: 101–127. - PubMed
-
- Carpita NC, Gibeaut DM. Structural models of primary cell walls in flowering plants: consistency of molecular structure with the physical properties of the walls during growth. Plant J. 1993; 3(1): 1–30. - PubMed
-
- Pauly M, Keegstra K. Plant cell wall polymers as precursors for biofuel. Curr Opin Plant Biol. 2010; 13: 305–312. doi: 10.1016/j.pbi.2009.12.009 - DOI - PubMed
MeSH terms
Substances
LinkOut - more resources
Full Text Sources
Other Literature Sources
