. 2017 Oct 1;26(19):3776-3791.
doi: 10.1093/hmg/ddx262.

Loss of SLC25A46 causes neurodegeneration by affecting mitochondrial dynamics and energy production in mice

Affiliations

Loss of SLC25A46 causes neurodegeneration by affecting mitochondrial dynamics and energy production in mice

Zhuo Li et al. Hum Mol Genet. .

Abstract

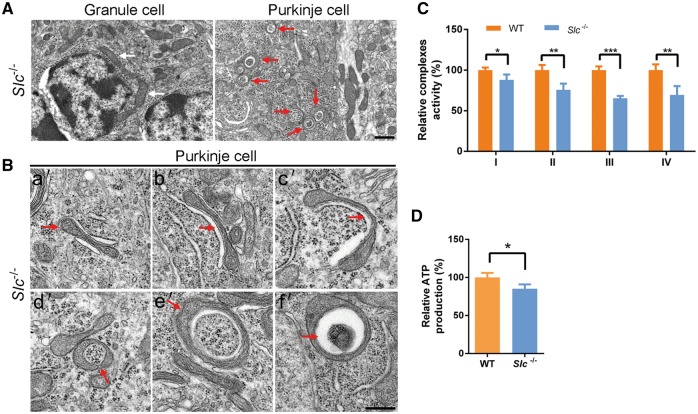
Recently, we identified biallelic mutations of SLC25A46 in patients with multiple neuropathies. Functional studies revealed that SLC25A46 may play an important role in mitochondrial dynamics by mediating mitochondrial fission. However, the cellular basis and pathogenic mechanism of the SLC25A46-related neuropathies are not fully understood. Thus, we generated a Slc25a46 knock-out mouse model. Mice lacking SLC25A46 displayed severe ataxia, mainly caused by degeneration of Purkinje cells. Increased numbers of small, unmyelinated and degenerated optic nerves as well as loss of retinal ganglion cells indicated optic atrophy. Compound muscle action potentials in peripheral nerves showed peripheral neuropathy associated with degeneration and demyelination in axons. Mutant cerebellar neurons have large mitochondria, which exhibit abnormal distribution and transport. Biochemically mutant mice showed impaired electron transport chain activity and accumulated autophagy markers. Our results suggest that loss of SLC25A46 causes degeneration in neurons by affecting mitochondrial dynamics and energy production.


Figures

Figure 1.
Figure 1.
Delayed growth and impaired motor coordination of Slc25a46−/− mice. (A) Schematic map of Slc25a46 with 46-bp deletion in exon 8. (B) Western blot analysis results of SLC25A46 protein expression in cerebrum and cerebellum. Loss of SLC25A46 was confirmed in Slc25a46−/− mice. (C) Slc25a46−/− mice exhibit growth deficiency at 6 weeks of age. (D) Weight measurement starting at P7. After P14, significantly decreased body weight was noted in Slc25a46−/− mice (P < 0.01; male, n = 8 for each group). (E) Kaplan-Meyer survival curve. Most SLC25A46−/− mice died prematurely. Few mice survived beyond 6 months (P < 0.001; WT, n = 30; Slc25a46+/-, n = 30; Slc25a46−/−, n = 35). Survival curves were analyzed by Mantel–Cox test. (F) Rotarod test for 4-week-old female mice. (***P < 0.001; WT, n = 8; Slc25a46+/-, n = 8; Slc25a46−/−, n = 6). Results are combined from two independent tests. (G) Locomotor test revealed that 4-week-old Slc25a46−/− female mice exhibited reduced motor activity (P < 0.001; WT, n = 8; Slc25a46+/-, n = 8; Slc25a46−/−, n = 6). Activity was recorded every 5 min over a 60-min period.
Figure 2.
Figure 2.
Purkinje cell loss and reduced dendritic branching. (A) Images of gross brains and H&E-stained mid-sagittal cerebellar sections. Scale bars: left bottom 2 images 800 μm; right bottom 2 images 200 μm. (B) Brain weight at different ages. (**P < 0.01, ***P < 0.001; WT control, n = 4; SLC25A46−/−, n = 4 for 3, 6, 9 weeks; n = 3 for 16 weeks). (C) IF with calbindin staining. White arrows indicate loss of PCs. Yellow arrows indicate reduced dendrites. Scale bars: left 2 images 100 μm; right 4 images 40 μm. (D,E) Quantitation for calbindin staining (D) and Purkinje cell number per section (E) of P21 and P60 mice (*P < 0.05, 10 sections were measured from 3 mice for each group). (F,G) Golgi staining for P30 and P60 mouse cerebellum. Red arrowheads indicate primary dendrites (F). Area of dendrites was quantified (G) (***P < 0.001, 60-80 stained cells in 10 sections from 2 mice for each group were measured). Scale bars: 40 μm.
Figure 3.
Figure 3.
Neurodegeneration in Slc25a46−/− mouse cerebellum. (A) Fluoro-Jade C staining of PCs in mouse cerebellum. Red arrows indicate degenerating axons; White arrows indicate degenerating dendrites; White arrowheads indicate degenerating soma. EM confirmed degenerated axons (red arrows). wm: white matter; gl: granule layer; Pcl: Purkinje cell layer; ml: molecular layer. Scale bars: top 4 images 40 μm; bottom 2 μm. (B) Semithin (1–2s μm) resin sections stained with toluidine blue of PCs in mouse cerebellum. Red arrowheads indicate degenerating somata; Red arrows indicate dysmorphic dendritic arbors; White arrowheads indicate somata with normal morphology. EM confirmed high dense staining cells underlying degeneration (Red arrows indicate degenerated PCs; White arrows indicate normal PCs), in which enlarged mitochondria with disorganized cristae (black arrowhead), shrunk nuclei (“N”), autophagic vacuole (yellow arrowhead) and dilated endoplasmic reticulum (green arrowhead) were observed. Scale bars: top 160 μm; middle 40 μm; bottom 2 μm. (C) IF with GFAP staining in mouse cerebellum. Scale bars: 40 μm. (D) IHC with CD68 staining. Red arrows indicate positive signals. Yellow boxes indicate the enlarged regions. Scale bars: 40 μm.
Figure 4.
Figure 4.
Enlarged mitochondria in Slc25a46−/− Purkinje cells. (A) EM of mitochondria in soma of PCs. Black arrows indicate normal mitochondria structure in WT. Thick red arrows indicate enlarged mitochondria, part of which appear to be the fusion of several mitochondria. Thin red arrows indicate mitochondria which may undergo mitophagy. Dark, dense cells indicate a degenerative cell body with shrunken shape. Scale bars: 2 μm. (B) EM of mitochondria in PC dendrites. Black arrows indicate slender, tubular mitochondria in small, WT PCs dendritic branches, which are close to the spines (Red arrowhead). Thick red arrow indicates enlarged mitochondria in Slc25a46−/− Purkinje cell dendrites. Asterisks indicate the congregation of large spherical mitochondria with swollen cristae at the dendritic intersection and are rarely found downstream around the spines. Scale bars: 2 μm. (C) Quantitation of maximum width of mitochondria in dendrites (***P < 0.001; 60 mitochondria from 10 images for each group were measured).
Figure 5.
Figure 5.
Ring-shaped mitochondria in Slc25a46−/− Purkinje cells and mitochondrial dysfunction in cerebellum. (A) EM of mitochondria in Slc25a46−/− granule cell and Purkinje cell. White arrows indicate mitochondria in Slc25a46−/− granule cell. Red arrows indicate C-shaped or ring-shaped mitochondria in Slc25a46−/− Purkinje cell at P30. Scale bars: 1 μm. (B) Different stages of ring-shaped mitochondria formation in Slc25a46−/− Purkinje cells at P30. (a’) Mitochondria elongated from the middle site. (b’-d’) Mitochondria bend around cytosolic constituents to form C-shape. (e’) Head and tail of individual mitochondria fused together to form ring-shape. (f’) Cytosolic constituents compressed and formed a vacuole in the center. Scale bars: 0.5 μm. (C) Mitochondrial enzymatic activity of respiratory chain complexes. Mitochondria were isolated from mouse cerebellum (*P < 0.05, **P < 0.01, ***P < 0.001; WT, n = 4; Slc25a46−/−, n = 4). (D) ATP level in cerebellum (*P < 0.05; WT, n = 4; Slc25a46−/−, n = 4). Data of (C,D) are representative of two independent replications.
Figure 6.
Figure 6.
Affected mitochondria distribution and transport in Slc25a46−/− Purkinje cells. (A) Cultured cerebellar neurons at 5 DIV were stained with calbindin to identify PCs. Mitochondria were labeled by MitoTracker. White arrowheads indicate dendrites of PCs. White arrows indicate axons of PCs. Swollen structures were seen in mutant PCs dendrites and axons. Purple arrows in enlarged images indicate mitochondria in dendrites. Purple arrowheads in enlarged images indicate mitochondria in cell body. Scale bar: 40 μm. (B) Kymograph analysis of mitochondrial mobility in dendrites of PCs. Large, round mitochondria were seen in mutant dendrites. (C,D) Analysis of velocity and path length of mitochondria in PCs dendrites via time-lapse during 100s (***P < 0.001; More than 100 mitochondria in each group were measured).
Figure 7.
Figure 7.
RGC loss and optic nerve demyelination and degeneration. (A) Optic disc and OCT scanning of P120 mice. Green line in optic disc images indicates position of OCT scanning. Scale bars: 63 μm. (B) Quantitation for retinal thickness from OCT scanning images (*P < 0.05, **P < 0.01; n = 3 for WT and Slc25a46−/− mice). (C) H&E and Brn-3a staining for retinas. Scale bars: 100 μm. (D) Quantitation of Brn-3a–positive RGCs in retinas of P70 mice (***P < 0.001, Brna-3a–positive RGCs were counted from six retinal sections of P70 mice) (n = 3 for WT and Slc25a46−/− mice). (E) Toluidine blue-stained semithin cross-sections and EM images of P60 optic nerves. Arrowheads indicate unmyelinated axons. Asterisk indicates degenerative axon underlying demyelination (arrow). Scale bars: top 20 μm; middle 8 μm; bottom 0.5 μm. (F) Scatterplot displays G-ratios of individual optic nerve axons (P < 0.01, data collected from 100–300 myelinated fibers per group; n = 3 for WT and Slc25a46−/− mice). (G) Distribution of axon diameters for optic nerves (P < 0.001; n = 3 for WT and Slc25a46−/− mice).
Figure 8.
Figure 8.
Peripheral neuropathy with axon degeneration and demyelination in Slc25a46−/− Mice. (A) When lifted by the tail, enhanced limb-clasping reflex was presented in Slc25a46−/− mice compared to WT mice at P60 (Top). Representative images showing hindlimb muscle atrophy in Slc25a46−/− mice at P120 (Bottom). (B-D) CMAP recordings of P60 sciatic nerve. CVs (C) and CMAP amplitudes (D), measured from recorded waves (B) (Arrows indicate onset of electrical stimulation of the sciatic nerve during recording) (n = 4 for WT and SLC25A46−/− mice; P < 0.001). Data are representative of two independent experiments. (E) Toluidine blue-stained semithin cross-sections and EM images of P60 WT and Slc25a46−/− sciatic nerves. Asterisks, degenerative axons; Arrows, demyelination; Arrowhead, autophagy. Scale bars: top 20 μm; middle 8 μm; bottom 2 μm. (F) Scatterplot displaying G-ratios of individual sciatic nerve axons (P < 0.001, data collected from 100–300 myelinated fibers per group; n = 3 for WT and Slc25a46−/− mice). (G) Distribution of axon diameters for sciatic nerves (P < 0.001, data collected from 100–300 myelinated fibers per group; n = 3 for WT and Slc25a46−/− mice). (H) Mitochondria in WT peripheral axon showed small size and even distribution (black arrow). Mitochondria often clumped together with disorganized cristae or loss of cristae (red arrow) in mutant mice. Scale bars: 2 μm. (I) Quantitation for mitochondrial diameter (***P < 0.001, data collected from 200-300 mitochondria per group; n = 3 for WT and Slc25a46−/− mice).

References

    1. Abrams A.J., Hufnagel R.B., Rebelo A., Zanna C., Patel N., Gonzalez M.A., Campeanu I.J., Griffin L.B., Groenewald S., Strickland A.V.. et al. (2015) Mutations in SLC25A46, encoding a UGO1-like protein, cause an optic atrophy spectrum disorder. Nat. Genet., 47, 926–932. - PMC - PubMed
    1. Charlesworth G., Balint B., Mencacci N.E., Carr L., Wood N.W., Bhatia K.P. (2016) SLC25A46 mutations underlie progressive myoclonic ataxia with optic atrophy and neuropathy. Mov. Disord., 31, 1249–1251. - PubMed
    1. Janer A., Prudent J., Paupe V., Fahiminiya S., Majewski J., Sgarioto N., Des Rosiers C., Forest A., Lin Z.Y., Gingras A.C.. et al. (2016) SLC25A46 is required for mitochondrial lipid homeostasis and cristae maintenance and is responsible for Leigh syndrome. EMBO Mol. Med., 8, 1019–1038. - PMC - PubMed
    1. Nguyen M., Boesten I., Hellebrekers D.M., Mulder-den Hartog N.M., de Coo I.F., Smeets H.J., Gerards M. (2017) Novel pathogenic SLC25A46 splice-site mutation causes an optic atrophy spectrum disorder. Clin. Genet., 91, 121–125. - PubMed
    1. Wan J., Steffen J., Yourshaw M., Mamsa H., Andersen E., Rudnik-Schoneborn S., Pope K., Howell K.B., McLean C.A., Kornberg A.J.. et al. (2016) Loss of function of SLC25A46 causes lethal congenital pontocerebellar hypoplasia. Brain, pii: aww212, DOI: 10.1093/brain/aww212 - PMC - PubMed

Publication types

Substances