Regulation of chromatin folding by conformational variations of nucleosome linker DNA
- PMID: 28934465
- PMCID: PMC5766201
- DOI: 10.1093/nar/gkx562
Regulation of chromatin folding by conformational variations of nucleosome linker DNA
Abstract
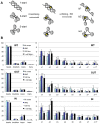
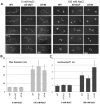
Linker DNA conformational variability has been proposed to direct nucleosome array folding into more or less compact chromatin fibers but direct experimental evidence for such models are lacking. Here, we tested this hypothesis by designing nucleosome arrays with A-tracts at specific locations in the nucleosome linkers to induce inward (AT-IN) and outward (AT-OUT) bending of the linker DNA. Using electron microscopy and analytical centrifugation techniques, we observed spontaneous folding of AT-IN nucleosome arrays into highly compact structures, comparable to those induced by linker histone H1. In contrast, AT-OUT nucleosome arrays formed less compact structures with decreased nucleosome interactions similar to wild-type nucleosome arrays. Adding linker histone H1 further increased compaction of the A-tract arrays while maintaining structural differences between them. Furthermore, restriction nuclease digestion revealed a strongly reduced accessibility of nucleosome linkers in the compact AT-IN arrays. Electron microscopy analysis and 3D computational Monte Carlo simulations are consistent with a profound zigzag linker DNA configuration and closer nucleosome proximity in the AT-IN arrays due to inward linker DNA bending. We propose that the evolutionary preferred positioning of A-tracts in DNA linkers may control chromatin higher-order folding and thus influence cellular processes such as gene expression, transcription and DNA repair.
© The Author(s) 2017. Published by Oxford University Press on behalf of Nucleic Acids Research.
Figures


Similar articles
-
Nucleosome spacing periodically modulates nucleosome chain folding and DNA topology in circular nucleosome arrays.J Biol Chem. 2019 Mar 15;294(11):4233-4246. doi: 10.1074/jbc.RA118.006412. Epub 2019 Jan 10. J Biol Chem. 2019. PMID: 30630950 Free PMC article.
-
A critical role for linker DNA in higher-order folding of chromatin fibers.Nucleic Acids Res. 2021 Mar 18;49(5):2537-2551. doi: 10.1093/nar/gkab058. Nucleic Acids Res. 2021. PMID: 33589918 Free PMC article.
-
Evidence for heteromorphic chromatin fibers from analysis of nucleosome interactions.Proc Natl Acad Sci U S A. 2009 Aug 11;106(32):13317-22. doi: 10.1073/pnas.0903280106. Epub 2009 Jul 27. Proc Natl Acad Sci U S A. 2009. PMID: 19651606 Free PMC article.
-
Chromatosome Structure and Dynamics from Molecular Simulations.Annu Rev Phys Chem. 2020 Apr 20;71:101-119. doi: 10.1146/annurev-physchem-071119-040043. Epub 2020 Feb 4. Annu Rev Phys Chem. 2020. PMID: 32017651 Review.
-
Chromatin structures condensed by linker histones.Essays Biochem. 2019 Apr 23;63(1):75-87. doi: 10.1042/EBC20180056. Print 2019 Apr 23. Essays Biochem. 2019. PMID: 31015384 Review.
Cited by
-
Determining mesoscale chromatin structure parameters from spatially correlated cleavage data using a coarse-grained oligonucleosome model.bioRxiv [Preprint]. 2024 Jul 29:2024.07.28.605011. doi: 10.1101/2024.07.28.605011. bioRxiv. 2024. PMID: 39131347 Free PMC article. Preprint.
-
Dynamics of Chromatin Fibers: Comparison of Monte Carlo Simulations with Force Spectroscopy.Biophys J. 2018 Nov 6;115(9):1644-1655. doi: 10.1016/j.bpj.2018.06.032. Epub 2018 Aug 30. Biophys J. 2018. PMID: 30236784 Free PMC article.
-
Structural features of nucleosomes in interphase and metaphase chromosomes.Mol Cell. 2021 Nov 4;81(21):4377-4397.e12. doi: 10.1016/j.molcel.2021.08.010. Epub 2021 Sep 2. Mol Cell. 2021. PMID: 34478647 Free PMC article.
-
Molecular recognition of nucleosomes by binding partners.Curr Opin Struct Biol. 2019 Jun;56:164-170. doi: 10.1016/j.sbi.2019.03.010. Epub 2019 Apr 13. Curr Opin Struct Biol. 2019. PMID: 30991239 Free PMC article. Review.
-
Nucleosome spacing periodically modulates nucleosome chain folding and DNA topology in circular nucleosome arrays.J Biol Chem. 2019 Mar 15;294(11):4233-4246. doi: 10.1074/jbc.RA118.006412. Epub 2019 Jan 10. J Biol Chem. 2019. PMID: 30630950 Free PMC article.
References
-
- Richmond T.J., Davey C.A.. The structure of DNA in the nucleosome core. Nature. 2003; 423:145–150. - PubMed
-
- Tremethick D.J. Higher-order structures of chromatin: the elusive 30 nm fiber. Cell. 2007; 128:651–654. - PubMed
-
- Fussner E., Ching R.W., Bazett-Jones D.P.. Living without 30nm chromatin fibers. Trends Biochem. Sci. 2011; 36:1–6. - PubMed
MeSH terms
Substances
LinkOut - more resources
Full Text Sources
Other Literature Sources

