. 2017 Sep 19;45(16):9726-9740.
doi: 10.1093/nar/gkx603.

Crystal structure of an engineered, HIV-specific recombinase for removal of integrated proviral DNA

Affiliations

Crystal structure of an engineered, HIV-specific recombinase for removal of integrated proviral DNA

Gretchen Meinke et al. Nucleic Acids Res. .

Abstract

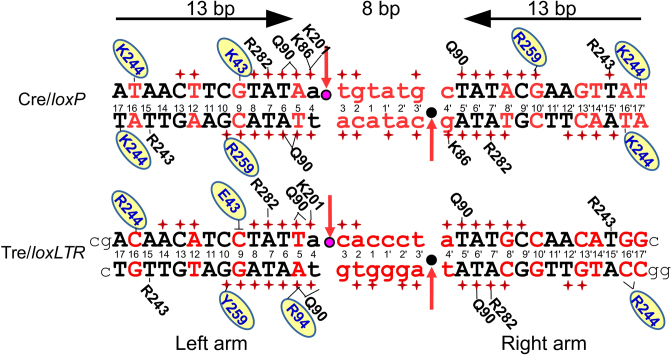
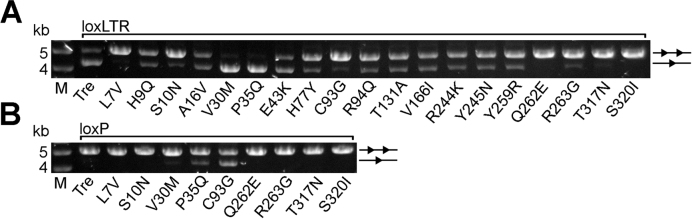
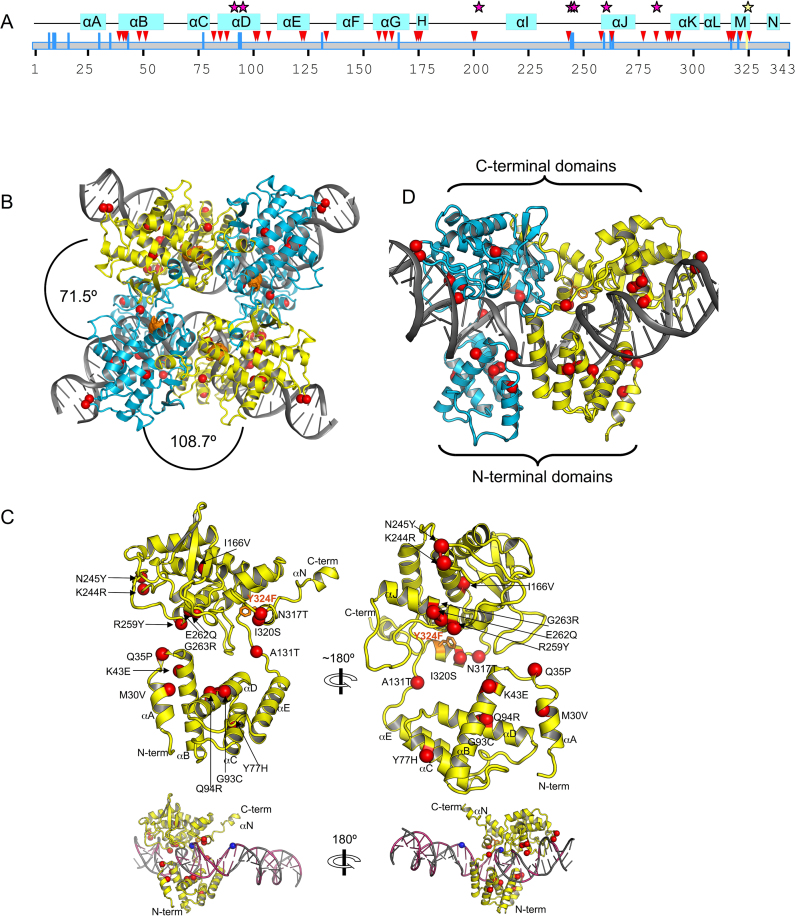
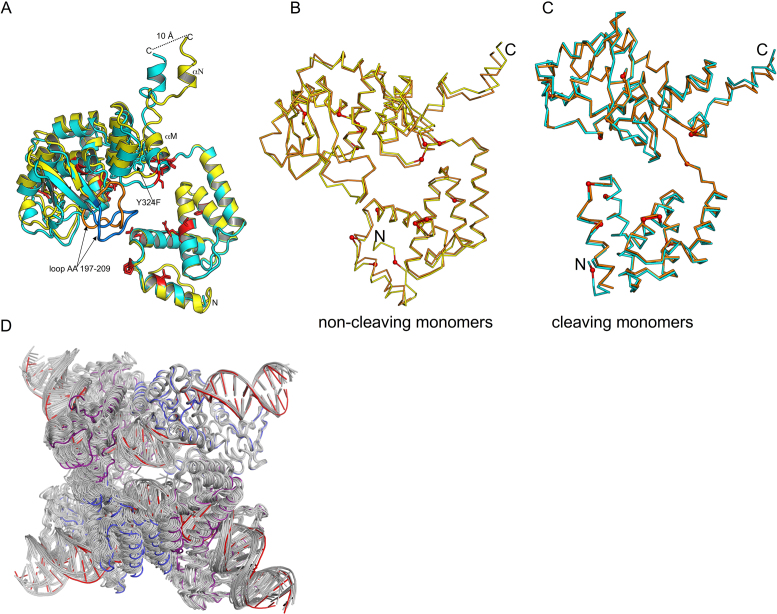
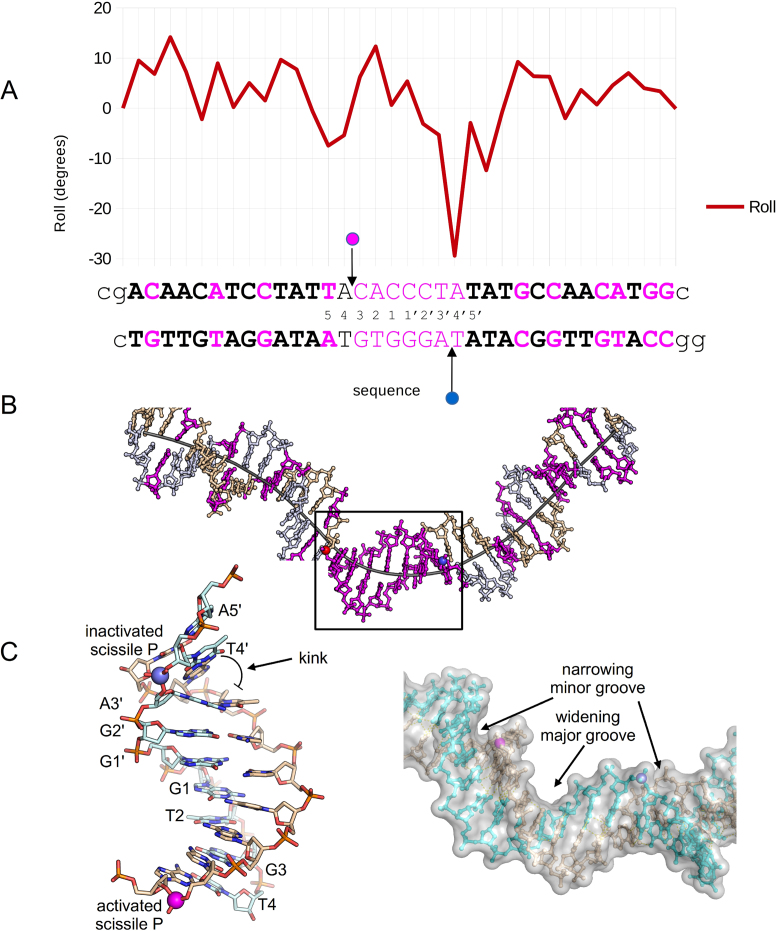
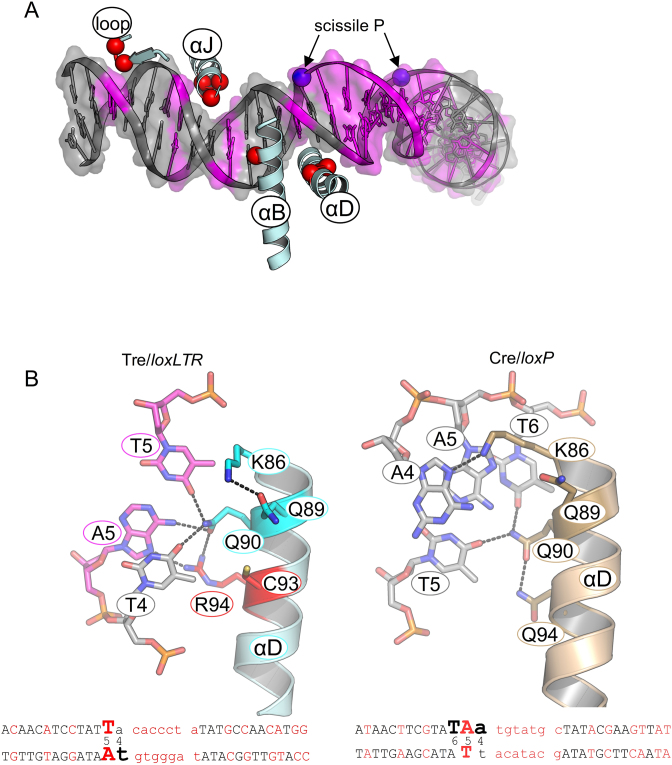
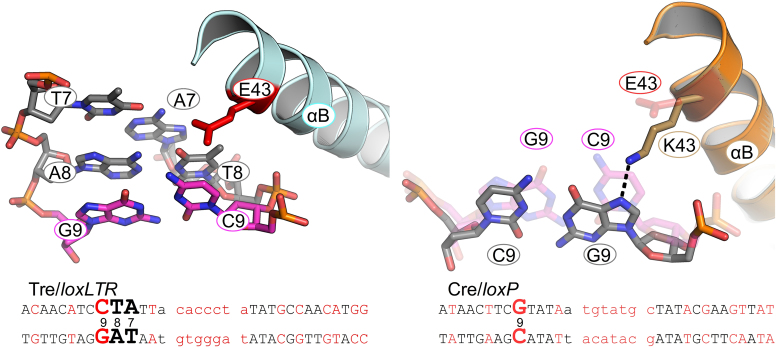
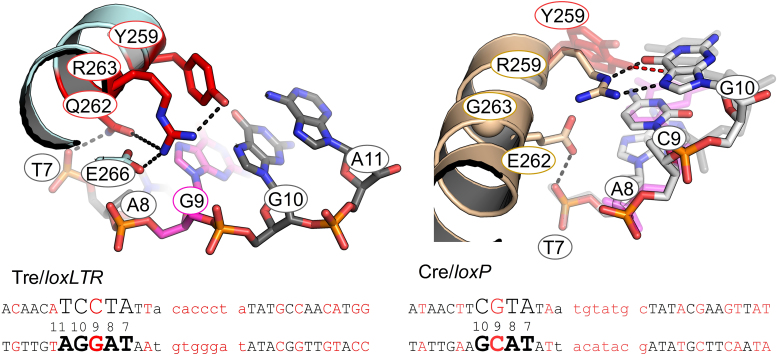
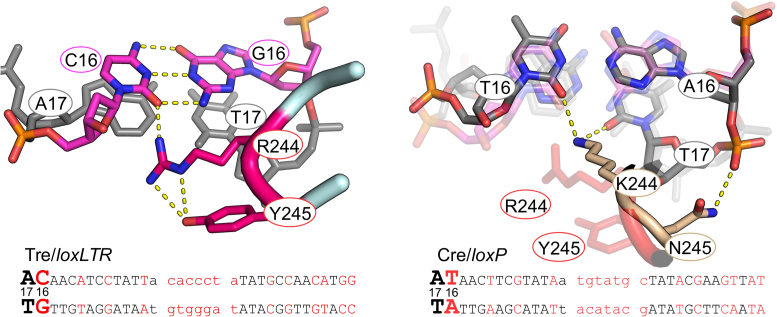
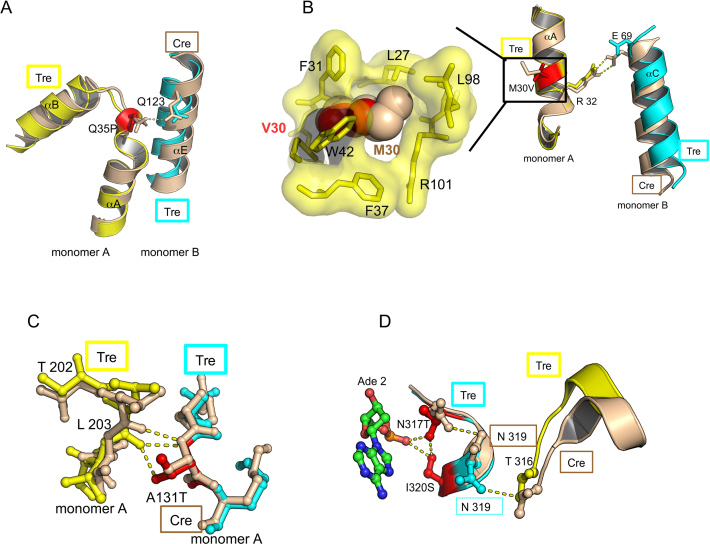
As part of the HIV infection cycle, viral DNA inserts into the genome of host cells such that the integrated DNA encoding the viral proteins is flanked by long terminal repeat (LTR) regions from the retrovirus. In an effort to develop novel genome editing techniques that safely excise HIV provirus from cells, Tre, an engineered version of Cre recombinase, was designed to target a 34-bp sequence within the HIV-1 LTR (loxLTR). The sequence targeted by Tre lacks the symmetry present in loxP, the natural DNA substrate for Cre. We report here the crystal structure of a catalytically inactive (Y324F) mutant of this engineered Tre recombinase in complex with the loxLTR DNA substrate. We also report that 17 of the 19 amino acid changes relative to Cre contribute to the altered specificity, even though many of these residues do not contact the DNA directly. We hypothesize that some mutations increase the flexibility of the Cre tetramer and that this, along with flexibility in the DNA, enable the engineered enzyme and DNA substrate to adopt complementary conformations.


Figures

Figure 1.
Figure 1.
Sequence of loxP and loxLTR recombination sites and schematic comparison of protein–DNA interactions for Cre/loxP and Tre/loxLTR. DNA sequences are black (conserved between loxP and loxLTR) or red (not conserved). Standard loxP numbering is shown. Lower case letters indicate the central 8-bp spacer region. The horizontal arrows indicate the orientation of the inverted repeat sequences in loxP and highlight the symmetry in the loxP target. The scissile phosphates are indicated by pink and black circles in the active and inactive arms, respectively. Red arrows indicate site of cleavage. Phosphate backbone interactions are indicated by a red +. Only residues involved in base-specific interactions are shown and are placed adjacent to the interacting base, with a solid line drawn to the base for clarity. Residues in blue letters on yellow oval indicate amino acid sequence difference between Cre and Tre. The ┴ indicates the loss of an interaction. The black lower case letters at the ends of the loxLTR sequence show the additional nucleotides used for crystallization of the Tre/loxLTR complex. The PDB ID: 3C29 was used for the Cre/loxP analysis (except for the K201 interaction which was 1NZB).
Figure 2.
Figure 2.
Recombination efficiency and specificity of Tre mutants on loxLTR and loxP. Agarose gel showing the activity of Tre mutants on loxLTR (A) and loxP (B), respectively, in comparison to Tre. Escherichia coli cells harboring the pEVO vector containing the respective recombinase coding sequence and indicated target site were grown at 100 μg/ml L-arabinose. Recombination was assayed by restriction enzyme digest, resulting in a smaller fragment for recombined (one triangle) and a larger fragment for non-recombined substrate (two triangles). M, DNA marker.
Figure 3.
Figure 3.
Overview of the Tre/loxLTR structure. (A) Schematic of secondary structure of Tre. The amino acid sequence of Tre is shown as a gray box and numbered below. Helices are indicated by blue boxes. Location of mutations relative to Cre are shown as blue lines. Protein–DNA phosphate interactions, and base-specific interactions are shown as pink triangles and stars, respectively. The location of the nucleophile 324 is indicated by a yellow line and yellow star. (B) Ribbon diagram of Tre/loxLTR tetrameric complex. Mutations in Tre relative to Cre are shown as red spheres centered at the C-α atom, and labeled. The mutated catalytic nucleophile Y324F is shown as orange sticks. The cleaving and non-cleaving conformers are colored cyan and yellow, respectively. The angular rotation required to superimpose Tre molecules is indicated. (C) Ribbon diagram of Tre monomer. Two views are shown for clarity. Mutations and α-helices are labeled. N and C termini indicated. A small view of the monomer on DNA is shown below. The loxLTR DNA is colored gray where its sequence matches loxP, and pink, where its sequence differs. The location of the scissile phosphates (blue spheres) is indicated. (D) Ribbon diagram of a Tre/loxLTR dimer.
Figure 4.
Figure 4.
Superposition of cleaving and non-cleaving conformers of Tre. (A) The N-terminal domains of cleaving conformer (cyan) and the non-cleaving conformer (yellow) are superimposed (RMSD ∼0.4 Å). The C-terminal domains differ by ∼6° rotation, and superimpose less well (RMSD ∼2.7 Å). The mutations relative to Cre are shown as red sticks. The conformational changes result in a displacement of the helices M and N at the C-terminus. The loop region (AA 197–209) also exhibits a large conformational change (∼14 Å distance between Thr 206). This loop is colored orange (non-cleaving conformer), and blue (cleaving conformer) for clarity. (B) Comparison of non-cleaving Tre and Cre conformers. Non-cleaving conformer of Tre (yellow) and Cre (orange) were superimposed. The location of Tre mutations are shown as small red spheres. (C) Comparison of cleaving Tre and Cre conformers. Cleaving conformer of Tre (cyan) and Cre (orange) were superimposed. The PDB ID used in this superposition was 3C29. (D) Superposition of Tre and other Cre structures. For each Cre tetramer, a Cre cleaving conformer was superimposed onto the Tre cleaving conformer. The results are displayed as a ribbon diagram with Cre/loxP colored gray and Tre cleaving and non-cleaving conformers colored blue and purple, and loxLTR colored red. The PDB IDs of the Cre/loxP structures used in this superposition are 1NZB, 4CRX, 5CRX, 3C28, 3C29, 1Q3U, 2HOF, 2HOI, 1Q3V, 1OUQ, 1CRX, 3MGV, 1PVP, 1PVQ, 1PVR, 1MA7. Note that Tre is often at the extreme ‘edge’ of the range of variability seen for the other Cre structures.
Figure 5.
Figure 5.
Tre/loxLTR DNA conformational analysis. (A) loxLTR DNA parameters Roll versus loxLTR sequence. The loxLTR sequence is shown below the graph and colored pink where there is a mutation relative to loxP. The letters in bold indicate the location of the 13 bp ‘arms.’ The pink and blue circles indicate the location of the active and inactive scissile phosphates, respectively. The lower case letters indicate the nucleotides present in the crystal structure. (B) A stick representation of the loxLTR DNA with a line representing the helical axis. The strands are colored beige and gray and are colored pink where there is a mutation relative to loxP. The scissile phosphates are depicted as spheres colored as in A. (C) (left) A close-up view of the boxed region from B, highlighting the kink adjacent to the inactivated phosphate. (right) A surface representation of the central region highlighting the width of the major and minor grooves, and the location of scissile phosphates shown as spheres.
Figure 6.
Figure 6.
Comparison of Tre/loxLTR and Cre/loxP protein–DNA interactions. (A) Overview of selected Tre segments on loxLTR shown as a ribbon diagram. Shown is the left arm of the LoxLTR colored gray (conserved) and magenta (mutated). The scissile phosphates shown as blue spheres. The Tre regions shown are labeled, and the location of the mutated residues present in these regions is shown as red spheres. (B) (Left) Close-up of the Tre Q94R/loxLTR interaction. Helix D from the cleaving Tre monomer (cyan, mutations colored red) bound to loxLTR (colored magenta where sequence differs from loxP) is shown. (Right) This shows the same region of Cre (light brown)/loxP. Hydrogen bond or polar interactions are indicated by dashed lines as determined by PyMOL or distance measurements. Below is the loxLTR or loxP sequence with the relevant base in a larger font to indicate where this interaction occurs in the DNA target.
Figure 7.
Figure 7.
Close-up of the Tre K43E/loxLTR interaction. Colored as in Figure 6. On the right panel, Tre/loxLTR are shown as transparent sticks.
Figure 8.
Figure 8.
Close-up of the Tre R259Y/loxLTR interaction. Colored as in Figure 6. On the right panel, Tre/loxLTR are shown as transparent sticks. In addition, Y324F from each of the two copies of the cleaving Tre is shown to highlight the conformational variability, where one is within hydrogen bonding distance. Also the loxLTR G 10 shifts relative to loxP ∼ 1.3 Å.
Figure 9.
Figure 9.
Close-up of the Tre K244R, N245Y/loxLTR interaction. Colored as in Figure 6. On the right panel, Tre/loxLTR is shown as transparent sticks to highlight the conformation differences in this region.
Figure 10.
Figure 10.
Tre mutations not involved in sequence-specific DNA interactions. (A) Close-up of Tre Q35P mutation. This view highlights loss of an intermolecular Gln 35 and Gln 123 hydrogen bond in the Q35P mutation. The mutated residues are colored red. Tre (yellow and cyan) and Cre (tan) are superimposed. Hydrogen bonds and salt bridges are shown by yellow dashed lines. (B) Close-up of Tre M30V mutation at protein–protein interface. This view highlights loss of salt bridge between Arg 32 in Glu 69 in the Tre/loxLTR complex. A close-up of the boxed portion shows the cavity formed by Val 30 (red spheres) versus Met 30 (tan spheres) (C) Close-up of Tre A131T mutation. This view highlights additional inter-molecular hydrogen bond in Tre between Thr 131 and Leu 203. (D) Close-up of N317T, I320S Tre mutation. This view highlights new intra- and intermolecular polar interactions.

Similar articles

Cited by

References

    1. Rathbun R.C., Lockhart S.M., Stephens J.R.. Current HIV treatment guidelines–an overview. Curr. Pharm. Des. 2006; 12:1045–1063. - PubMed
    1. Buchholz F., Hauber J.. Antiviral therapy of persistent viral infection using genome editing. Curr. Opin. Virol. 2016; 20:85–91. - PubMed
    1. van Lunzen J., Fehse B., Hauber J.. Gene therapy strategies: can we eradicate HIV. Curr. HIV/AIDS Rep. 2011; 8:78–84. - PubMed
    1. Khalili K., Kaminski R., Gordon J., Cosentino L., Hu W.. Genome editing strategies: potential tools for eradicating HIV-1/AIDS. J. Neurovirol. 2015; 21:310–321. - PMC - PubMed
    1. Govindan G., Ramalingam S.. Programmable site-specific nucleases for targeted genome engineering in higher eukaryotes. J. Cell. Physiol. 2016; 231:2380–2392. - PubMed