. 2017 Sep 19;45(16):e150.
doi: 10.1093/nar/gkx631.

SupeRNAlign: a new tool for flexible superposition of homologous RNA structures and inference of accurate structure-based sequence alignments

Affiliations

SupeRNAlign: a new tool for flexible superposition of homologous RNA structures and inference of accurate structure-based sequence alignments

Pawel Piatkowski et al. Nucleic Acids Res. .

Abstract

RNA has been found to play an ever-increasing role in a variety of biological processes. The function of most non-coding RNA molecules depends on their structure. Comparing and classifying macromolecular 3D structures is of crucial importance for structure-based function inference and it is used in the characterization of functional motifs and in structure prediction by comparative modeling. However, compared to the numerous methods for protein structure superposition, there are few tools dedicated to the superimposing of RNA 3D structures. Here, we present SupeRNAlign (v1.3.1), a new method for flexible superposition of RNA 3D structures, and SupeRNAlign-Coffee-a workflow that combines SupeRNAlign with T-Coffee for inferring structure-based sequence alignments. The methods have been benchmarked with eight other methods for RNA structural superposition and alignment. The benchmark included 151 structures from 32 RNA families (with a total of 1734 pairwise superpositions). The accuracy of superpositions was assessed by comparing structure-based sequence alignments to the reference alignments from the Rfam database. SupeRNAlign and SupeRNAlign-Coffee achieved significantly higher scores than most of the benchmarked methods: SupeRNAlign generated the most accurate sequence alignments among the structure superposition methods, and SupeRNAlign-Coffee performed best among the sequence alignment methods.


Figures

Figure 1.
Figure 1.
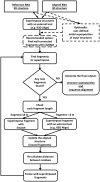
SupeRNAlign workflow. Optional steps are indicated with dashed lines.
Figure 2.
Figure 2.
Graphical illustration of the SupeRNAlign workflow, using as an example a pair of two tRNA(Asn) molecules (PDB code: 3KFU, reference structure shown in dark grey; and PDB code: 4WJ4, aligned structure shown in other colors). (A) First round: result of superposition of two RNA structures treated as rigid bodies; the aligned structure is then analyzed by ClaRNet and two substructures identified are colored blue and orange. (B) Second round: result of independent superposition of two fragments of the aligned structure identified by ClaRNet onto the corresponding fragments of the reference structure; a fragment identified as ‘well superimposed’ and frozen for further iterations is indicated in cyan, while the remaining fragments will continue being subjected to superposition. (C) Third round: result of superposition of fragments that remained ‘free’ after the previous iteration, an additional region in the CCA stem is found to be ‘well superimposed’ and is colored in cyan, regions that remain above the threshold of ‘good superposition’ remains shown in blue and orange colors. (D) The final superposition, in which the single-stranded CCA terminus (in the bottom left corner) is superimposed well and colored in cyan, while the superposition of other ‘free’ fragments (now shown in gray) does not improve according to SupeRNAlign; this superposition is used to generate the final sequence alignment.
Figure 3.
Figure 3.
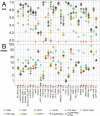
A comparison of the accuracy of benchmarked methods. These boxplots show the distribution of scores (A, sum-of-pairs; B, RMSD (in Å, shown in logarithmic scale) obtained by the RNA superposition methods. Boxes mark quartiles (Q1, median, Q3); whiskers stretch from 1st to 99th percentile; outliers are shown as dots.
Figure 4.
Figure 4.
A comparison of the accuracy of benchmarked methods within RNA families. The plots show scores (A, sum-of-pairs; B, RMSD (in Å, logarithmic scale) obtained by the benchmarked programs for each RNA family. Each symbol represents the median value of score for the particular family—different programs are marked with colors and symbols. SupeRNAlign and SupeRNAlign-Coffee are denoted in black. The families where either SupeRNAlign or SupeRNAlign-Coffee performed best are marked with red dots. The families are sorted alphabetically, and this sorting order is consistent with the order in the tables to facilitate comparison of results.

Similar articles

Cited by

References

    1. Atkinson H.J., Morris J.H., Ferrin T.E., Babbitt P.C.. Using sequence similarity networks for visualization of relationships across diverse protein superfamilies. PLoS ONE. 2009; 4:e4345. - PMC - PubMed
    1. Murzin A.G., Brenner S.E., Hubbard T., Chothia C.. SCOP: a structural classification of proteins database for the investigation of sequences and structures. J. Mol. Biol. 1995; 247:536–540. - PubMed
    1. Orengo C.A., Michie A.D., Jones S., Jones D.T., Swindells M.B., Thornton J.M.. CATH–a hierarchic classification of protein domain structures. Structure. 1997; 5:1093–1108. - PubMed
    1. Holm L., Sander C.. Dali: a network tool for protein structure comparison. Trends Biochem. Sci. 1995; 20:478–480. - PubMed
    1. Zhang Y., Skolnick J.. TM-align: a protein structure alignment algorithm based on the TM-score. Nucleic Acids Res. 2005; 33:2302–2309. - PMC - PubMed

Publication types

LinkOut - more resources