. 2017 Sep 19;45(16):9528-9546.
doi: 10.1093/nar/gkx632.

Antisense oligonucleotides targeting translation inhibitory elements in 5' UTRs can selectively increase protein levels

Affiliations

Antisense oligonucleotides targeting translation inhibitory elements in 5' UTRs can selectively increase protein levels

Xue-Hai Liang et al. Nucleic Acids Res. .

Abstract

A variety of diseases are caused by deficiencies in amounts or activity of key proteins. An approach that increases the amount of a specific protein might be of therapeutic benefit. We reasoned that translation could be specifically enhanced using trans-acting agents that counter the function of negative regulatory elements present in the 5' UTRs of some mRNAs. We recently showed that translation can be enhanced by antisense oligonucleotides (ASOs) that target upstream open reading frames. Here we report the amount of a protein can also be selectively increased using ASOs designed to hybridize to other translation inhibitory elements in 5' UTRs. Levels of human RNASEH1, LDLR, and ACP1 and of mouse ACP1 and ARF1 were increased up to 2.7-fold in different cell types and species upon treatment with chemically modified ASOs targeting 5' UTR inhibitory regions in the mRNAs encoding these proteins. The activities of ASOs in enhancing translation were sequence and position dependent and required helicase activity. The ASOs appear to improve the recruitment of translation initiation factors to the target mRNA. Importantly, ASOs targeting ACP1 mRNA significantly increased the level of ACP1 protein in mice, suggesting that this approach has therapeutic and research potentials.


Figures

Figure 1.
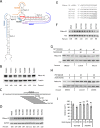
Figure 1.
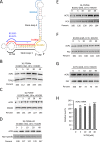
ASOs targeting the 5′ UTR of RNASEH1 mRNA increase protein production. (A) Predicted secondary structure of the 5′ UTR of RNASEH1. The upper case letters indicate coding sequence. The start codon of the uORF is highlighted in blue. Binding sites for ASOs are indicated by lines. (B) Western blot for RNASEH1 in HeLa cells treated with indicated ASOs for 15 h at 25 nM. Numbers below the lanes are percentages of RNASEH1 protein relative to mock-treated cells; values are normalized to quantity of tubulin loading. (C) Schematic representation of ASO positions on RNASEH1 bracketing active ASO761919. (D) Western blot for RNASEH1 in HeLa cells treated for 15 h with 25 nM indicated ASOs. GAPDH was used as a loading control. (E) Sequences of RNASEH1 mRNA and ASOs with mismatches (underlined). (F) Western analysis for RNASEH1 protein in HeLa cells treated with 30 nM indicated ASOs for 10 h. P32 was detected as a loading control. (G) Western analyses for RNASEH1 in HeLa cells co-transfected with the RNASEH1 ASO761919 and an ASO complementary to the RNASEH1 ASO (ASO927728). ASO concentration 0 indicates mock transfection. (H) Western blot analyses for RNASEH1 in HeLa cells co-transfected for 10 h with ASO761919 and a control ASO759704. The mean values and standard deviations after normalization to P32 quantity are shown below the lanes. (I) qRT-PCR quantification of RNASEH1 mRNA in cells treated with indicated ASOs. The error bars represent standard deviations from three experiments. P-values were calculated based on unpaired t-test. NS, not significant. **P < 0.01.
Figure 2.
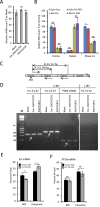
Figure 2.
The ASO increases RNASEH1 protein level by enhancing translation. (A) qRT-PCR quantification of RNASEH1 mRNA in HeLa cells treated with control ASO761703 or RNASEH1 ASO761919 for 10 h. (B) qRT-PCR quantification of DROSHA, Malat1, and RNASEH1 RNAs in cytoplasmic and nuclear fractions of HeLa cells treated with control ASO761703 or ASO761919 for 10 h. Plotted are mean relative RNA levels ± standard deviations of three experiments. (C) Schematic representation of the 5′ region of RNASEH1 mRNA. Primers used for RT-PCR are indicated by arrows and the expected sizes of PCR products are shown. (D) The level and splicing patterns for exons 1, 2, and 3 of RNASEH1 mRNA in ASO and control treated HeLa cells. PTEN mRNA served as a loading control. (E) qRT-PCR quantification of RNASEH1 mRNA (left panel) or PTEN mRNA (right panel) in monosome (80S) and polysome fractions of HeLa cells treated with 30 nM ASO759704 (control) or ASO761919 for 7 h. The error bars are standard deviations from three experiments. P-values were calculated based on unpaired t-test. NS, not significant. *P < 0.05; **P < 0.01.
Figure 3.
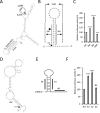
Figure 3.
Predicted structure in LDLR 5′ UTR inhibits translation. (A) Predicted secondary structure of a region of the 5′ UTR of human LDLR mRNA. The shadowed areas indicate uAUGs. The ASO binding sites are indicate by lines. (B) RNA sequence and mutations in the predicted structure region of LDLR mRNA; sequence is shown for the region of the mRNA beginning at position 1. The stem structure involves the base at position +4. The complementary mutations are indicated. The arrow head indicates an A–C mismatch. (C) Luciferase activity of the reporters containing wild-type or mutated LDLR 5′ UTR sequences shown in panel B analyzed in HEK293 cells. (D) Predicted secondary structure of the LDLR 5′ UTR with the 5′ side mutation. The position of newly formed stem structure relative to the 5′ end is indicated; this stem involves the base at position +2. (E) Schematic of structure and deletion mutations in the predicted structure region of LDLR 5′ UTR. (F) Luciferase activity of the reporters containing deletions shown in panel E. Error bars are standard deviations of three experiments. P values were calculated based on unpaired t-test. NS, not significant. ***P < 0.001; ****P< 0.0001.
Figure 4.
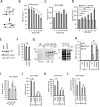
Figure 4.
Translation of LDLR protein is enhanced by targeting the predicted structure using an ASO. (A) The potential effect of an ASO on the predicted structure is depicted. (B) ELISA analyses for LDLR protein levels in HEK293 cells transfected for 15 h with XL824, which targets the 5′ side of the predicted stem. (C) qRT-PCR quantification of LDLR mRNA in cells treated with XL824. (D) ELISA analyses for LDLR protein in HEK293 cells transfected for 15 h with ASO814923, targeting the 3′ side of the potential stem or an ASO XL506 targeting a potential uORF. ASO concentration 0 indicates mock transfection. (E) Western analyses for LDLR protein in HEK293 cells treated with 30 nM ASO814923 for 10 h. Levels were normalized to those of GAPDH. (F) qRT-PCR quantification of LDLR mRNA levels in HEK293 cells treated with the ASO. (G) Autoradiography of 35S-methionine-labeled nascent LDLR protein isolated by immunoprecipitation from cells treated with ASO814923 (+) or mock-treated (–) for 7 h. An aliquot of cell lysate used for immunoprecipitation was analyzed by SDS-PAGE, and labeled nascent proteins were visualized by autoradiography (right panel). The level of nascent LDLR protein was normalized to signal from band marked by an arrow, and relative levels are given below the lanes. (H) qRT-PCR quantification of LDLR mRNA co-immunoprecipitated using an anti-eIF4A antibody or control IgG from mock transfected HEK293 cells (UTC) or cells treated with the ASO814923 for 10 h. 7SL RNA and RNASEH1 mRNA were quantified as controls. (I) LDL uptake in HEK293 cells treated with 30 nM ASO814923 or 30 nM control ASO812662 for 15 h. (J) qRT-PCR for LDLR mRNA levels in HEK293 cells treated with siRNA targeting luc or LDLR for 4 h, followed by treatment with or without ASO814923 (40 nM) for an additional 10 h. (K) ELISA analyses for LDLR protein levels in HEK293 cells treated with siRNAs, followed by treatment with ASO814923. (L) LDL uptake in HEK293 cells treated with siRNAs for 4 h, followed by treatment of the ASO for 10 h, and LDL uptake analysis. The error bars are standard deviations from three experiments. P-values were calculated based on unpaired t-test. NS, not significant. **P < 0.01; ***P < 0.001 and ****P < 0.0001.
Figure 5.
Figure 5.
ASOs with different modifications can increase LDLR protein levels. (A) ELISA analysis for LDLR protein levels in HeLa cells treated with ASO842196 for 15 h at different concentrations. (B) ELISA analyses for LDLR protein levels in HEK293 cells transfected with ASO842196, ASO842197, or ASO842206 at indicated concentrations for 12 h. Means ± standard deviations of three independent experiments are plotted. P-values were calculated based on unpaired t-test. ***P < 0.001; ****P < 0.0001.
Figure 6.
Figure 6.
ASOs targeting a predicted stem structure in the ACP1 5′ UTR increase ACP1 protein levels in HEK293 cells. (A) The predicted secondary structure of a region of the 5′ UTR of human ACP1 mRNA. The ASO binding sites are indicated by lines. The upper case letters in the mRNA indicate coding region sequence. Western analyses were performed to detect ACP1 protein in HEK293 cells transfected for 10–15 h with a 16-mer PO/Me ASO (B) and a PS/Me ASO (C), an 18-mer PS/Me-cEt ASO (D), a 16-mer PO/Me ASO targeting a slightly downstream sequence (E), and an 18-mer PO/Me ASO targeting a further downstream stem (F). A 16-mer PO/Me ASO targeting the 5′ side the 5′-most stem was also tested (G). Proteins used as loading controls are indicated in each panel. The percentages of ACP1 relative to protein levels in mock treated cells are listed below the lanes. (H) qRT-PCR for the levels of ACP1 mRNA in cells treated with XL753 for 10 h. Means ± standard deviations of three independent experiments are plotted. P-values were calculated based on unpaired t-test. **P < 0.01.
Figure 7.
Figure 7.
The ACP1 ASO enhances binding of translation initiation factors to ACP1 mRNA. (A) Western analyses of ACP1 and LDLR proteins in HeLa cells treated for 30 h with 15 μM 4E1Rcat. The lower panel shows a Coomassie-blue stained image from a duplicate gel, which serves as control to ensure equal loading. (B) Western analysis for DHX29 in HEK293 cells treated with 3 nM siRNAs targeting DHX29 or luc for 24 h. (C) Western analysis for ACP1 protein in HEK293 cells treated with DHX29 or luc siRNAs for 24 h, followed by transfection of ASO812653 for an additional 10 h. ANXA2 served as a loading control. The percentages of ACP1 protein relative to mock treated cells (ASO concentration 0) are shown below the lanes. (D) Western analyses for eIF4A (upper panel) and eIF2a (middle panel) proteins co-isolated with a 3′-biotinylated, 5′-capped RNA derived from the 5′ UTR of human ACP1 mRNA in the presence of ASO812658, control ASO XL398, or no ASO. The same membrane was re-probed using rabbit serum to detect non-specific band that served as loading control (lower panel, indicated by an asterisk). Percentages relative to samples with no ASO are given. (E) qRT-PCR quantification of ACP1 mRNA (left panel), 7SL RNA (middle panel), and ACTB mRNA (right panel) co-immunoprecipitated using an anti-eIF4A antibody or a control IgG from cells transfected with indicated ASOs or mock-transfected cells (UTC). Plotted are means ± standard deviations from three experiments. P-values were calculated based on unpaired t-test. NS, not significant. *P < 0.05.
Figure 8.
Figure 8.
ASO treatment increases ACP1 protein levels in mouse cells and in animals. (A) The predicted secondary structure of a region of the 5′ UTR of mouse ACP1 mRNA. The binding site for the ASOs is indicated. (B) Western analysis for ACP1 in MHT cells transfected for 10 h with PO ASO827814. TCP1β served as a loading control. (C) Western analysis for ACP1 in MHT cells transfected for 10 h with PS ASO827815. TCP1β served as a loading control. Percentages relative to mock treated samples are given. (D) Western analyses for ACP1 protein levels in liver homogenates of mice (N = 3) treated twice at a 48-h interval with ACP1 ASO827817. (E) Western analysis for ACP1 protein levels in liver homogenates of mice treated with control ASO866017. TMED10 served as a loading control. (F) Quantification of ACP1 as a percentage of protein in saline-treated mice. Error bars represent standard deviations (N = 3). P-values were calculated based on unpaired t-test. *P < 0.05; **P < 0.01; NS, not significant. (G) qRT-PCR quantification of ACP1 mRNA levels in the liver samples from mice treated with different ASOs. Equal portions of liver homogenates from each group were pooled, and total RNA was prepared and subjected to qRT-PCR. The error bars represent standard deviations from three independent experiments.

Similar articles

Cited by

References

    1. Wilson J.A., Richardson C.D.. Future promise of siRNA and other nucleic acid based therapeutics for the treatment of chronic HCV. Infect. Disord. Drug Targets. 2006; 6:43–56. - PubMed
    1. Lu P.Y., Xie F., Woodle M.C.. In vivo application of RNA interference: from functional genomics to therapeutics. Adv. Genet. 2005; 54:117–142. - PMC - PubMed
    1. Bennett C.F., Swayze E.E.. RNA targeting therapeutics: molecular mechanisms of antisense oligonucleotides as a therapeutic platform. Annu. Rev. Pharmacol. Toxicol. 2010; 50:259–293. - PubMed
    1. Crooke S.T.V.T.A., Lima W.F., Wu H.-J.. Crooke ST. Antisense Drug Technology - Principles, Strategies, and Applications. 2008; 2nd edn, Boca Raton: CRC Press; 3–46.
    1. Rossbach M. Small non-coding RNAs as novel therapeutics. Curr. Mol. Med. 2010; 10:361–368. - PubMed