Concerted action of two 3' cap-independent translation enhancers increases the competitive strength of translated viral genomes
- PMID: 28934492
- PMCID: PMC5766195
- DOI: 10.1093/nar/gkx643
Concerted action of two 3' cap-independent translation enhancers increases the competitive strength of translated viral genomes
Abstract
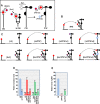
Several families of plant viruses evolved cap-independent translation enhancers (3'CITE) in the 3' untranslated regions of their genomic (g)RNAs to compete with ongoing cap-dependent translation of cellular mRNAs. Umbravirus Pea enation mosaic virus (PEMV)2 is the only example where three 3'CITEs enhance translation: the eIF4E-binding Panicum mosaic virus-like translational enhancer (PTE) and ribosome-binding 3' T-shaped structure (TSS) have been found in viruses of different genera, while the ribosome-binding kl-TSS that provides a long-distance interaction with the 5' end is unique. We report that the PTE is the key translation promoting element, but inhibits translation in cis and in trans in the absence of the kl-TSS by sequestering initiation factor eIF4G. PEMV2 strongly outcompeted a cellular mRNA mimic for translation, indicating that the combination of kl-TSS and PTE is highly efficient. Transferring the 3'-5' interaction from the kl-TSS to the PTE (to fulfill its functionality as found in other viruses) supported translationin vitro, but gRNA did not accumulate to detectable levels in protoplasts in the absence of the kl-TSS. It was shown that the PTE in conjunction with the kl-TSS did not markedly affect the translation initiation rate but rather increased the number of gRNAs available for translation. A model is proposed to explain how 3'CITE-based regulation of ribosome recruitment enhances virus fitness.
© The Author(s) 2017. Published by Oxford University Press on behalf of Nucleic Acids Research.
Figures


Similar articles
-
The 3' untranslated region of Pea Enation Mosaic Virus contains two T-shaped, ribosome-binding, cap-independent translation enhancers.J Virol. 2014 Oct;88(20):11696-712. doi: 10.1128/JVI.01433-14. Epub 2014 Aug 6. J Virol. 2014. PMID: 25100834 Free PMC article.
-
Identification of Novel 5' and 3' Translation Enhancers in Umbravirus-Like Coat Protein-Deficient RNA Replicons.J Virol. 2022 Apr 13;96(7):e0173621. doi: 10.1128/jvi.01736-21. Epub 2022 Mar 17. J Virol. 2022. PMID: 35297668 Free PMC article.
-
A ribosome-binding, 3' translational enhancer has a T-shaped structure and engages in a long-distance RNA-RNA interaction.J Virol. 2012 Sep;86(18):9828-42. doi: 10.1128/JVI.00677-12. Epub 2012 Jul 3. J Virol. 2012. PMID: 22761367 Free PMC article.
-
3' Cap-independent translation enhancers of positive-strand RNA plant viruses.Curr Opin Virol. 2011 Nov;1(5):373-80. doi: 10.1016/j.coviro.2011.10.002. Epub 2011 Oct 24. Curr Opin Virol. 2011. PMID: 22440838 Review.
-
Cap-independent translation of plant viral RNAs.Virus Res. 2006 Jul;119(1):63-75. doi: 10.1016/j.virusres.2005.10.010. Epub 2005 Dec 19. Virus Res. 2006. PMID: 16360925 Free PMC article. Review.
Cited by
-
A conserved RNA structure is essential for a satellite RNA-mediated inhibition of helper virus accumulation.Nucleic Acids Res. 2019 Sep 5;47(15):8255-8271. doi: 10.1093/nar/gkz564. Nucleic Acids Res. 2019. PMID: 31269212 Free PMC article.
-
The 3' Untranslated Region of a Plant Viral RNA Directs Efficient Cap-Independent Translation in Plant and Mammalian Systems.Pathogens. 2019 Feb 28;8(1):28. doi: 10.3390/pathogens8010028. Pathogens. 2019. PMID: 30823456 Free PMC article.
-
Structural characterization of a new subclass of panicum mosaic virus-like 3' cap-independent translation enhancer.Nucleic Acids Res. 2022 Feb 22;50(3):1601-1619. doi: 10.1093/nar/gkac007. Nucleic Acids Res. 2022. PMID: 35104872 Free PMC article.
-
Novel 3' Proximal Replication Elements in Umbravirus Genomes.Viruses. 2022 Nov 23;14(12):2615. doi: 10.3390/v14122615. Viruses. 2022. PMID: 36560619 Free PMC article.
-
Panicum Mosaic Virus and Its Satellites Acquire RNA Modifications Associated with Host-Mediated Antiviral Degradation.mBio. 2019 Aug 27;10(4):e01900-19. doi: 10.1128/mBio.01900-19. mBio. 2019. PMID: 31455653 Free PMC article.
References
-
- Aitken C.E., Lorsch J.R.. A mechanistic overview of translation initiation in eukaryotes. Nat. Struct. Mol. Biol. 2012; 19:568–576. - PubMed
-
- Shatsky I.N., Dmitriev S.E., Andreev D.E., Terenin I.M.. Transcriptome-wide studies uncover the diversity of modes of mRNA recruitment to eukaryotic ribosomes. Crit. Rev. Biochem. Mol. Biol. 2014; 49:164–177. - PubMed
-
- Hellen C.U.T., Sarnow P.. Internal ribosome entry sites in eukaryotic mRNA molecules. Genes Dev. 2001; 15:1593–1612. - PubMed
MeSH terms
Substances
Grants and funding
LinkOut - more resources
Full Text Sources
Other Literature Sources
Miscellaneous

