. 2017 Sep 19;45(16):9573-9582.
doi: 10.1093/nar/gkx673.

Co-produced natural ketolides methymycin and pikromycin inhibit bacterial growth by preventing synthesis of a limited number of proteins

Affiliations

Co-produced natural ketolides methymycin and pikromycin inhibit bacterial growth by preventing synthesis of a limited number of proteins

Mashal M Almutairi et al. Nucleic Acids Res. .

Abstract

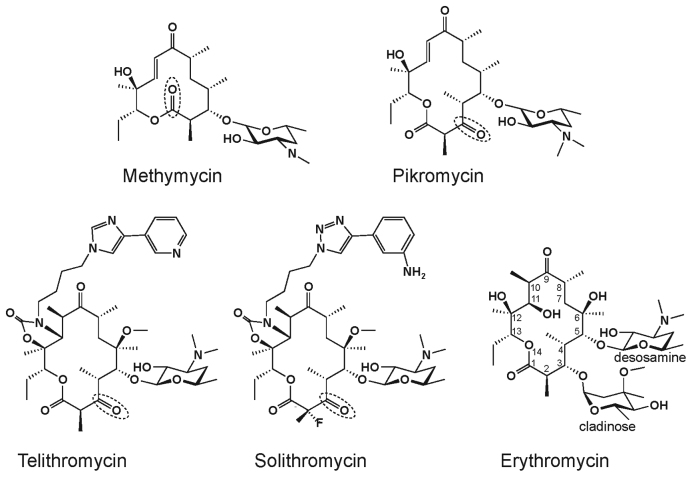
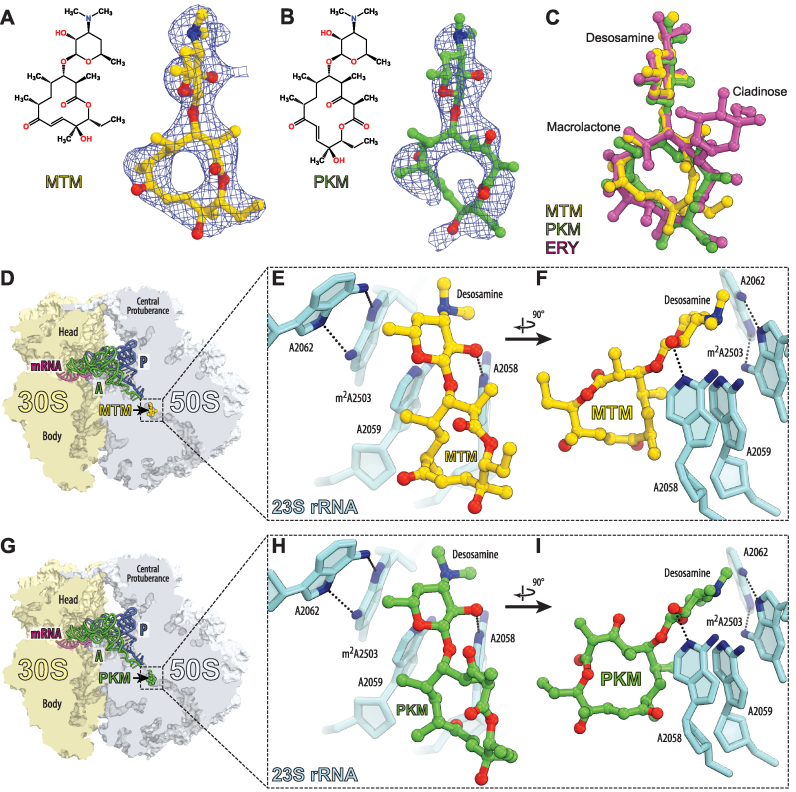
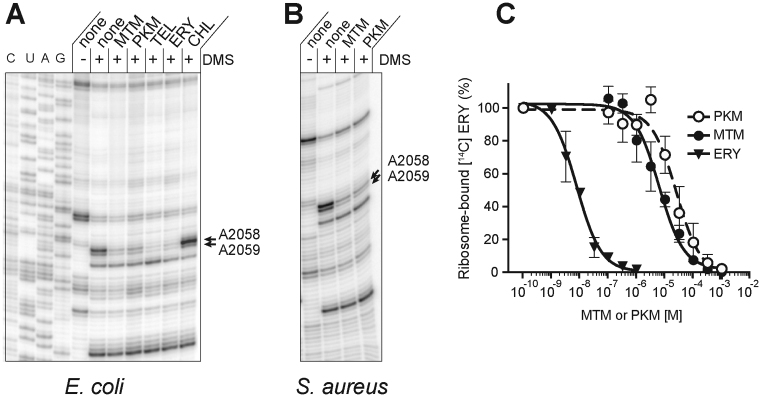
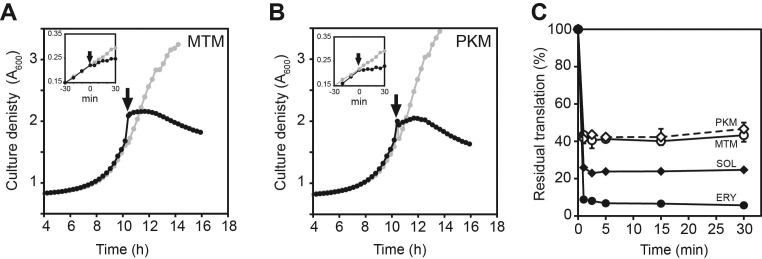
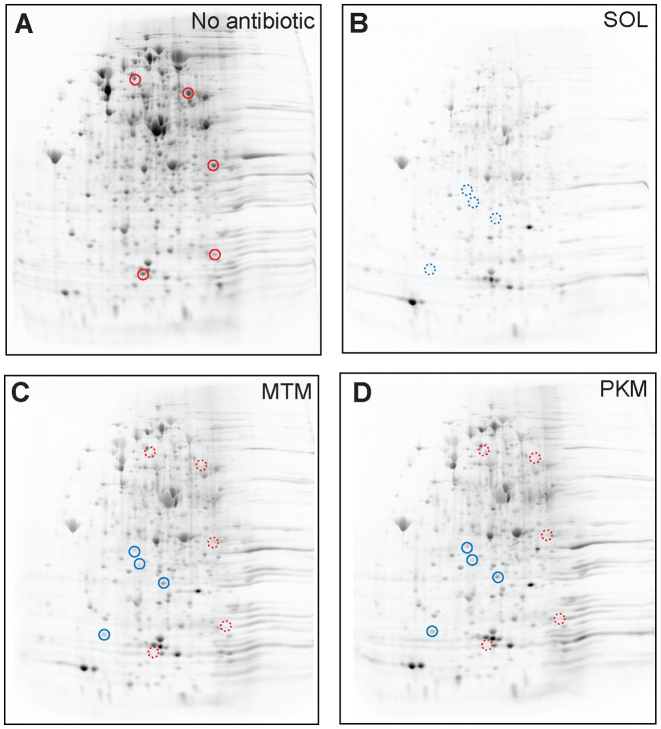
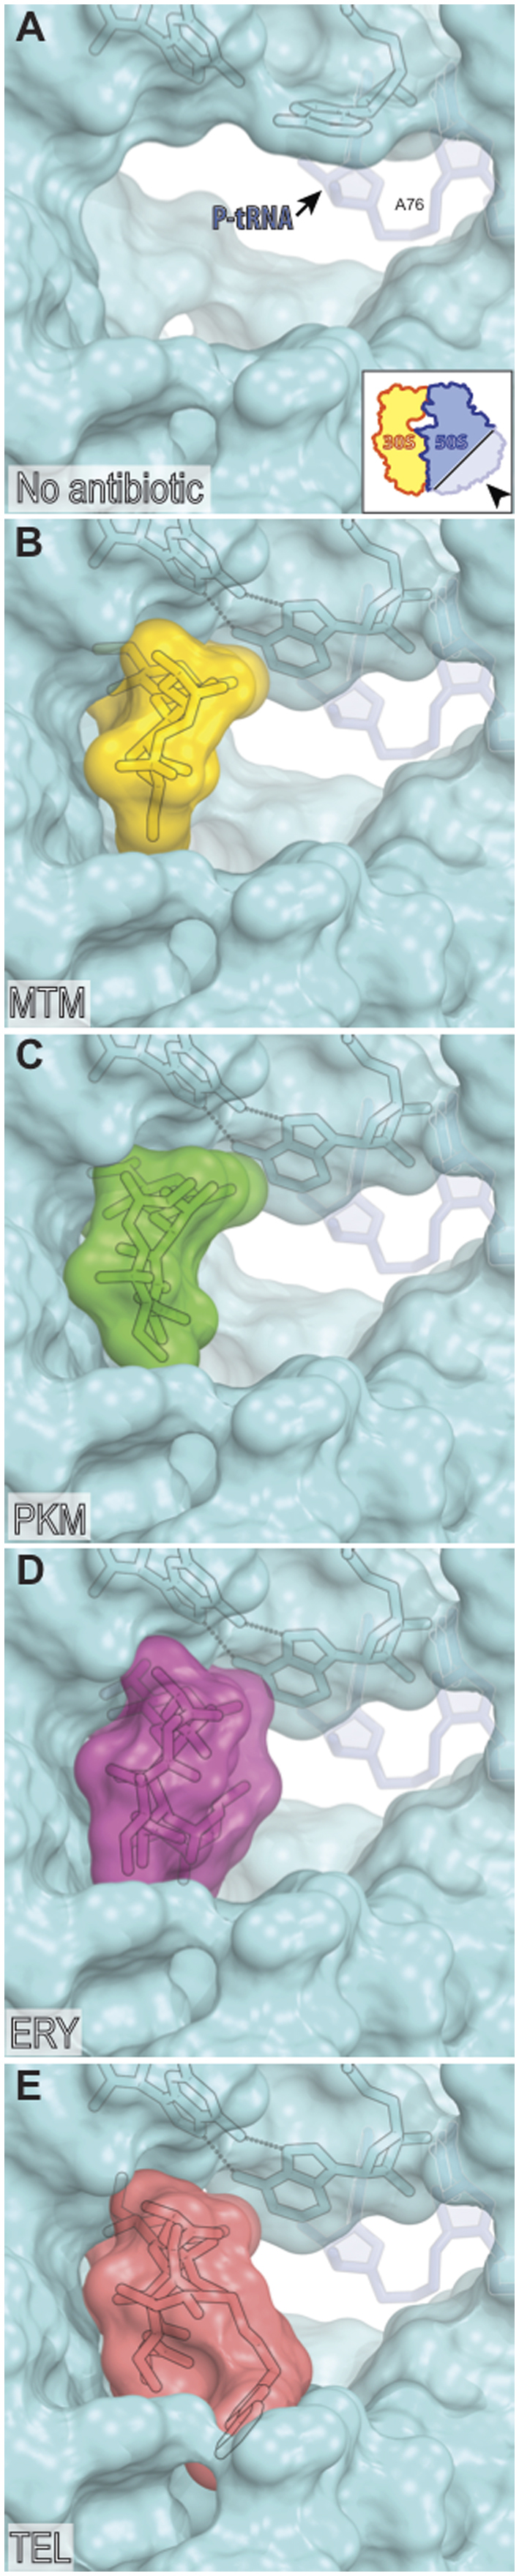
Antibiotics methymycin (MTM) and pikromycin (PKM), co-produced by Streptomyces venezuelae, represent minimalist macrolide protein synthesis inhibitors. Unlike other macrolides, which carry several side chains, a single desosamine sugar is attached to the macrolactone ring of MTM and PKM. In addition, the macrolactone scaffold of MTM is smaller than in other macrolides. The unusual structure of MTM and PKM and their simultaneous secretion by S. venezuelae bring about the possibility that two compounds would bind to distinct ribosomal sites. However, by combining genetic, biochemical and crystallographic studies, we demonstrate that MTM and PKM inhibit translation by binding to overlapping sites in the ribosomal exit tunnel. Strikingly, while MTM and PKM readily arrest the growth of bacteria, ∼40% of cellular proteins continue to be synthesized even at saturating concentrations of the drugs. Gel electrophoretic analysis shows that compared to other ribosomal antibiotics, MTM and PKM prevent synthesis of a smaller number of cellular polypeptides illustrating a unique mode of action of these antibiotics.


Figures

Figure 1.
Figure 1.
Chemical structures of natural ketolides methymycin and pikromycin, semi-synthetic ketolides telithromycin and solithromycin and cladinose-containing macrolide erythromycin. The atom numbering of the macrolactone ring is indicated on the ERY structure and the cladinose and desosamine sugars are marked. Keto group, in which ketolides replaces cladinose, is marked by a dotted oval in the corresponding structures.
Figure 2.
Figure 2.
Crystallographic structures of MTM and PKM in complex with 70S ribosome and A- and P-tRNAs. (A and B) Chemical structures and difference Fourier maps of MTM (A) and PKM (B) in complex with the Thermus thermophilus 70S ribosome (blue mesh). The refined model of each compound is displayed in its respective electron density before the refinement. The unbiased (FobsFcalc) difference electron density map is contoured at 3.0 σ. Carbon atoms are colored yellow for MTM and green for PKM, nitrogens are in blue, oxygens are in red. (C) Structural comparison of the ribosome-bound MTM (yellow), PKM (green) and ERY (magenta). Structure of ERY is from PDB code: 4V7X (37). All three structures of ribosome-bound antibiotics were aligned based on domain V of the 23S rRNA. (D and G) Overview of the MTM (D) and PKM (G) binding sites in the T. thermophilus 70S ribosome viewed as a cross-cut through the peptide exit tunnel. 30S subunit is shown in light yellow, 50S subunit is in light blue, mRNA is shown in magenta and tRNAs are displayed in green for the A-site, and in dark blue for the P-site. E-site tRNA is omitted for clarity. (E, F, H and I) Close-up views of the MTM (E and F) or PKM (H and I) binding site shown in panels (D and G). Escherichia coli numbering of the nucleotides in the 23S rRNA is used.
Figure 3.
Figure 3.
In vitro binding of MTM and PKM to the NPET. (A and B) DMS probing of interactions of antibiotics with (A) Escherichia coli or (B) Staphylococcus aureus ribosomes. Cladinose-containing macrolide ERY, ketolide TEL or PTC-binding antibiotic CHL were used as controls. The arrows indicate the 23S rRNA residues A2058 and A2059, located in the macrolide-binding site in the NPET. Samples in the lanes marked ‘none’ contained no antibiotic. (C) Competitive binding of non-radioactive ERY, PKM or MTM with [14C] ERY to E. coli 70S ribosomes. The MTM and PKM binding experiments were done in triplicates, the binding of the control antibiotic, ERY, was analyzed in duplicate samples. Assuming ERY Kd being 10.8 nM (18), the estimated Ki of MTM and PKM were 13.1 ± 3.5 and 3.2 ± 1.6 μM, respectively.
Figure 4.
Figure 4.
MTM and PKM abolish cell growth but allow translation to continue at high level. (A and B) Addition of MTM (A) or PKM (B) at 100-fold MIC causes rapid arrest of cell growth. Cell culture densities were recorded at 600 nm in a 96-well plate reader. Gray dots and curves represent cultures grown without antibiotics, black dots and curves show the growth of the cultures to which antibiotics were added at the time points marked by arrows. The inlets show the results of similar experiments but performed in 15 ml culture tubes with more frequent time-points measurements; the antibiotics were added at the time point marked as zero. (C) Residual translation in Escherichia coli cells treated for the indicated duration of time with 100-fold MIC of MTM (open circles), PKM (open diamonds), ERY (filled circles) or SOL (filled diamonds).
Figure 5.
Figure 5.
MTM and PKM inhibit synthesis of a limited subset of proteins. 2D gel electrophoresis of [35S]-labeled proteins synthesized in the Escherichia coli cells treated with no antibiotics (A) or exposed for 10 min to 100-fold MIC of a control ketolide SOL (B), MTM (C) or PKM (D). Spots representing examples of proteins whose translation is notably inhibited by MTM or PKM are indicated in the control sample (A) by solid red circles and corresponding sites are shown by dotted red circles in panels (C) and (D). Proteins that are efficiently inhibited by SOL, but not by MTM or PKM are marked by dotted blue circles (panel B); the corresponding sites are shown by solid blue circles in panels (C) and (D).
Figure 6.
Figure 6.
Partial occlusion of the NPET by MTM and PKM. (A) Lumen of the NPET of the drug-free Thermus thermophilus ribosome (PDB code: 4Y4P (20)). The view is from the inside of the tunnel towards the PTC. A76 of the P-site tRNA, which normally carries formyl-methionine or a growing peptide chain, is shown in gray. A-site tRNA is not visible in this view. (B–E) Occlusion of the NPET by MTM (B), PKM (C), cladinose-containing macrolide ERY (D) and clinical ketolide TEL (E). Structures of ERY and TEL are from PDB codes 4V7X and 4V7S, respectively (37).

References

    1. Gaynor M., Mankin A.S.. Macrolide antibiotics: binding site, mechanism of action, resistance. Curr. Top. Med. Chem. 2003; 3:949–961. - PubMed
    1. Wilson D.N. The A-Z of bacterial translation inhibitors. Crit. Rev. Biochem. Mol. Biol. 2009; 44:393–433. - PubMed
    1. Davis A.R., Gohara D.W., Yap M.N.. Sequence selectivity of macrolide-induced translational attenuation. Proc. Natl. Acad. Sci. U.S.A. 2014; 111:15379–15384. - PMC - PubMed
    1. Kannan K., Kanabar P., Schryer D., Florin T., Oh E., Bahroos N., Tenson T., Weissman J.S., Mankin A.S.. The general mode of translation inhibition by macrolide antibiotics. Proc. Natl. Acad. Sci. U.S.A. 2014; 111:15958–15963. - PMC - PubMed
    1. Kannan K., Vázquez-Laslop N., Mankin A.S.. Selective protein synthesis by ribosomes with a drug-obstructed exit tunnel. Cell. 2012; 151:508–520. - PubMed

MeSH terms