

A novel requirement for DROSHA in maintenance of mammalian CG methylation
- PMID: 28934503
- PMCID: PMC5766157
- DOI: 10.1093/nar/gkx695
A novel requirement for DROSHA in maintenance of mammalian CG methylation
Erratum in
-
A novel requirement for DROSHA in maintenance of mammalian CG methylation.Nucleic Acids Res. 2017 Sep 19;45(16):9810. doi: 10.1093/nar/gkx736. Nucleic Acids Res. 2017. PMID: 28934508 Free PMC article. No abstract available.
Abstract
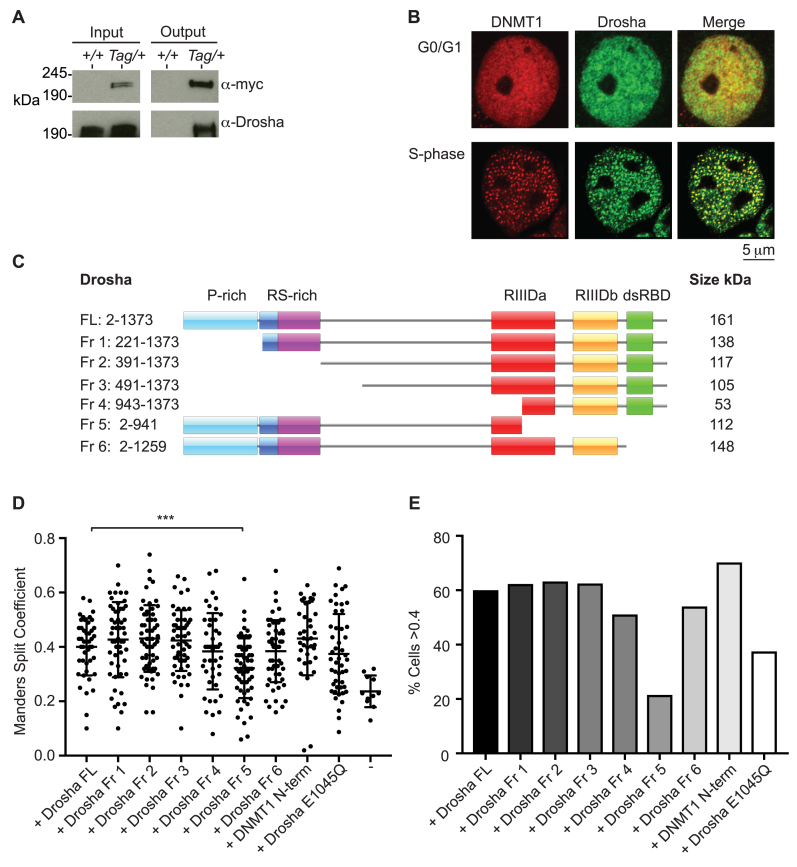
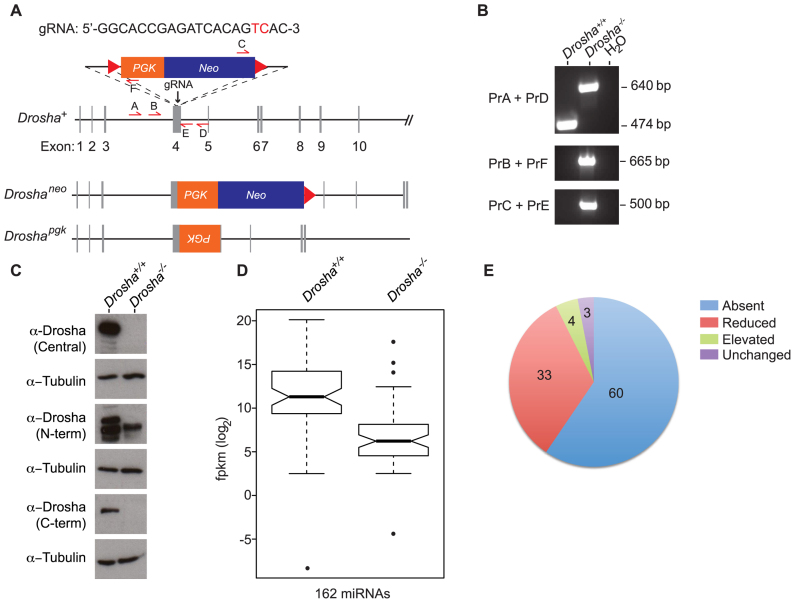
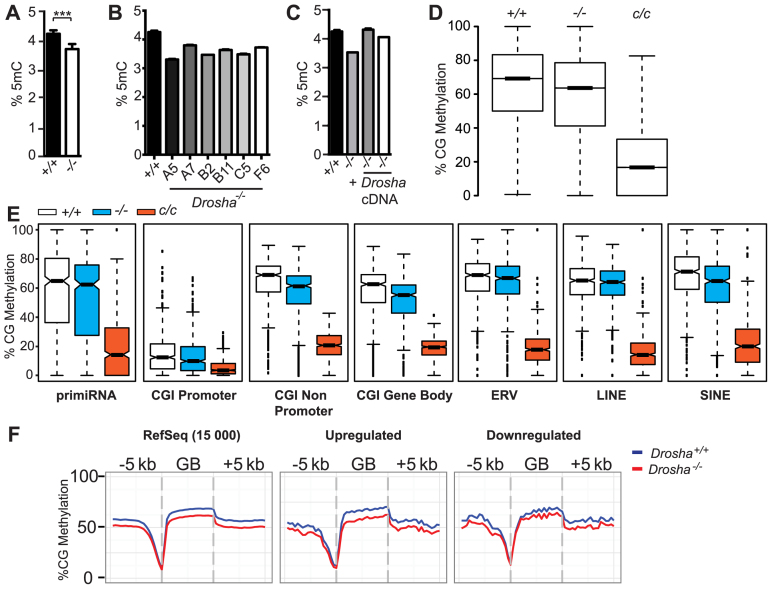
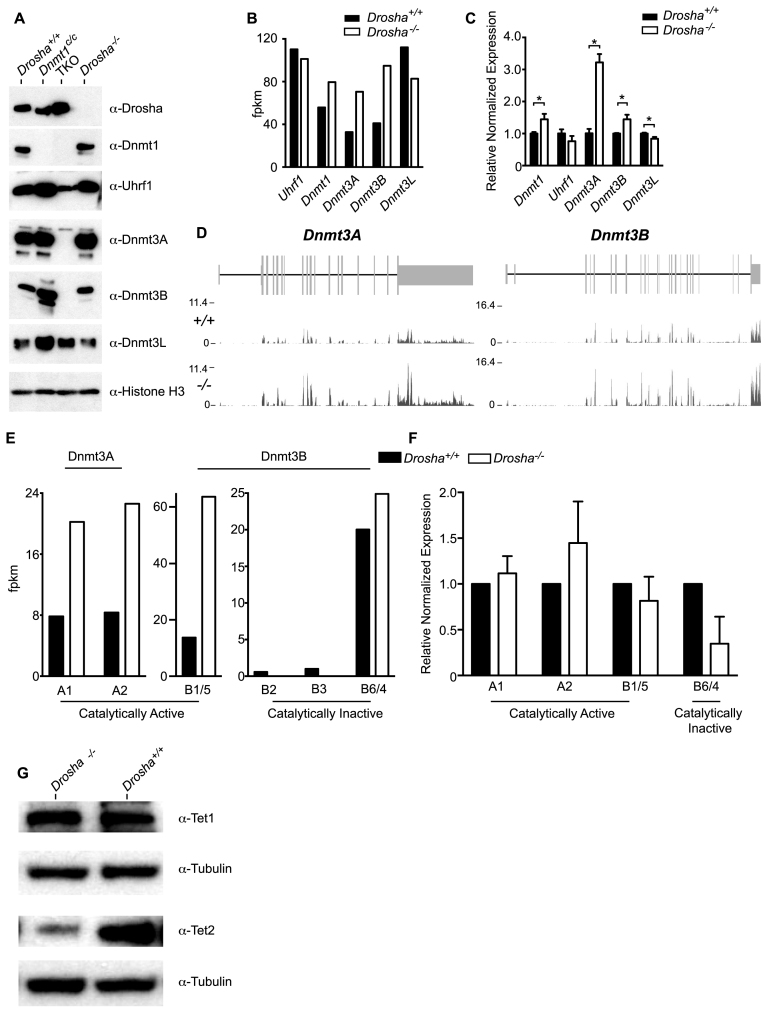
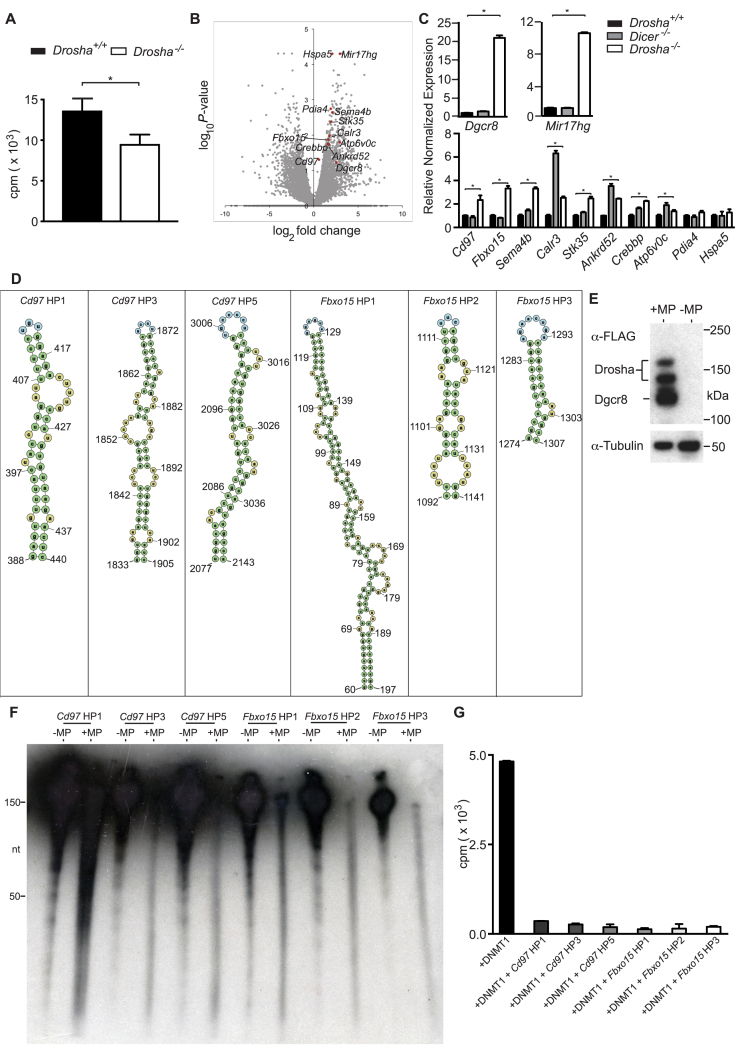
In mammals, faithful inheritance of genomic methylation patterns ensures proper gene regulation and cell behaviour, impacting normal development and fertility. Following establishment, genomic methylation patterns are transmitted through S-phase by the maintenance methyltransferase Dnmt1. Using a protein interaction screen, we identify Microprocessor component DROSHA as a novel DNMT1-interactor. Drosha-deficient embryonic stem (ES) cells display genomic hypomethylation that is not accounted for by changes in the levels of DNMT proteins. DNMT1-mediated methyltransferase activity is also reduced in these cells. We identify two transcripts that are specifically upregulated in Drosha- but not Dicer-deficient ES cells. Regions within these transcripts predicted to form stem-loop structures are processed by Microprocessor and can inhibit DNMT1-mediated methylation in vitro. Our results highlight DROSHA as a novel regulator of mammalian DNA methylation and we propose that DROSHA-mediated processing of RNA is necessary to ensure full DNMT1 activity. This adds to the DROSHA repertoire of non-miRNA dependent functions as well as implicating RNA in regulating DNMT1 activity and correct levels of genomic methylation.
© The Author(s) 2017. Published by Oxford University Press on behalf of Nucleic Acids Research.
Figures
Similar articles
-
Distinct roles of DNMT1-dependent and DNMT1-independent methylation patterns in the genome of mouse embryonic stem cells.Genome Biol. 2015 Jun 2;16(1):115. doi: 10.1186/s13059-015-0685-2. Genome Biol. 2015. PMID: 26032981 Free PMC article.
-
Normal DNA methylation dynamics in DICER1-deficient mouse embryonic stem cells.PLoS Genet. 2012 Sep;8(9):e1002919. doi: 10.1371/journal.pgen.1002919. Epub 2012 Sep 6. PLoS Genet. 2012. PMID: 22969435 Free PMC article.
-
DNA methylation-mediated down-regulation of DNA methyltransferase-1 (DNMT1) is coincident with, but not essential for, global hypomethylation in human placenta.J Biol Chem. 2010 Mar 26;285(13):9583-9593. doi: 10.1074/jbc.M109.064956. Epub 2010 Jan 13. J Biol Chem. 2010. PMID: 20071334 Free PMC article.
-
Mammalian cytosine DNA methyltransferase Dnmt1: enzymatic mechanism, novel mechanism-based inhibitors, and RNA-directed DNA methylation.Curr Med Chem. 2008;15(1):92-106. doi: 10.2174/092986708783330700. Curr Med Chem. 2008. PMID: 18220765 Review.
-
Role of Mammalian DNA Methyltransferases in Development.Annu Rev Biochem. 2020 Jun 20;89:135-158. doi: 10.1146/annurev-biochem-103019-102815. Epub 2019 Dec 9. Annu Rev Biochem. 2020. PMID: 31815535 Review.
Cited by
-
The Mutagenic Consequences of DNA Methylation within and across Generations.Epigenomes. 2022 Oct 4;6(4):33. doi: 10.3390/epigenomes6040033. Epigenomes. 2022. PMID: 36278679 Free PMC article. Review.
-
RXR Agonists Enhance Lenalidomide Anti-Myeloma Activity and T Cell Functions while Retaining Glucose-Lowering Effect.Cells. 2023 Aug 3;12(15):1993. doi: 10.3390/cells12151993. Cells. 2023. PMID: 37566072 Free PMC article.
-
PPAR agonists attenuate lenalidomide's anti-myeloma activity in vitro and in vivo.Cancer Lett. 2022 Oct 1;545:215832. doi: 10.1016/j.canlet.2022.215832. Epub 2022 Jul 22. Cancer Lett. 2022. PMID: 35872263 Free PMC article.
-
Epigenetic dynamics in cancer stem cell dormancy.Cancer Metastasis Rev. 2020 Sep;39(3):721-738. doi: 10.1007/s10555-020-09882-x. Cancer Metastasis Rev. 2020. PMID: 32394305 Review.
-
The Role of Host Cell DNA Methylation in the Immune Response to Bacterial Infection.Front Immunol. 2021 Jul 29;12:696280. doi: 10.3389/fimmu.2021.696280. eCollection 2021. Front Immunol. 2021. PMID: 34394088 Free PMC article. Review.
References
-
- Goll M.G., Bestor T.H.. Eukaryotic cytosine methyltransferases. Ann. Rev. Biochem. 2005; 74:481–514. - PubMed
-
- Okano M., Bell D.W., Haber D.A., Li E.. DNA methyltransferases Dnmt3a and Dnmt3b are essential for de novo methylation and mammalian development. Cell. 1999; 99:247–257. - PubMed
-
- Leonhardt H., Page A.W., Weier H.U., Bestor T.H.. A targeting sequence directs DNA methyltransferase to sites of DNA replication in mammalian nuclei. Cell. 1992; 71:865–873. - PubMed
MeSH terms
Substances
LinkOut - more resources
Full Text Sources
Other Literature Sources
Molecular Biology Databases
Research Materials
