. 2017 Sep 19;45(16):e146.
doi: 10.1093/nar/gkx591.

Combining asymmetric 13C-labeling and isotopic filter/edit NOESY: a novel strategy for rapid and logical RNA resonance assignment

Affiliations

Combining asymmetric 13C-labeling and isotopic filter/edit NOESY: a novel strategy for rapid and logical RNA resonance assignment

Regan M LeBlanc et al. Nucleic Acids Res. .

Abstract

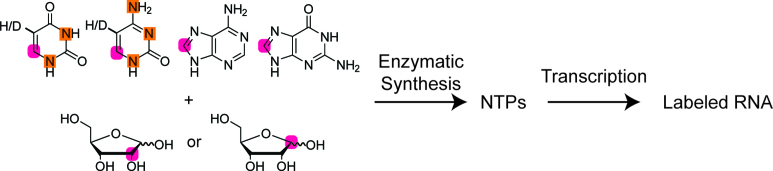
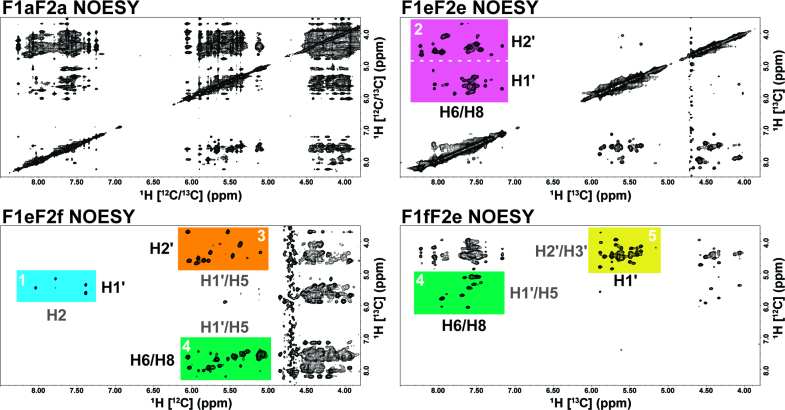
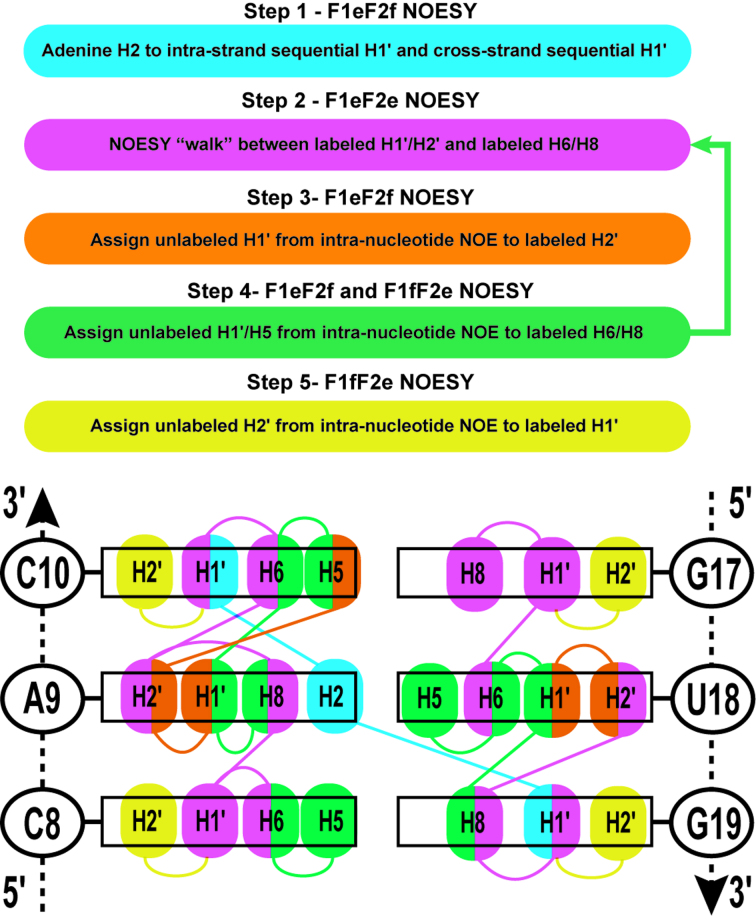
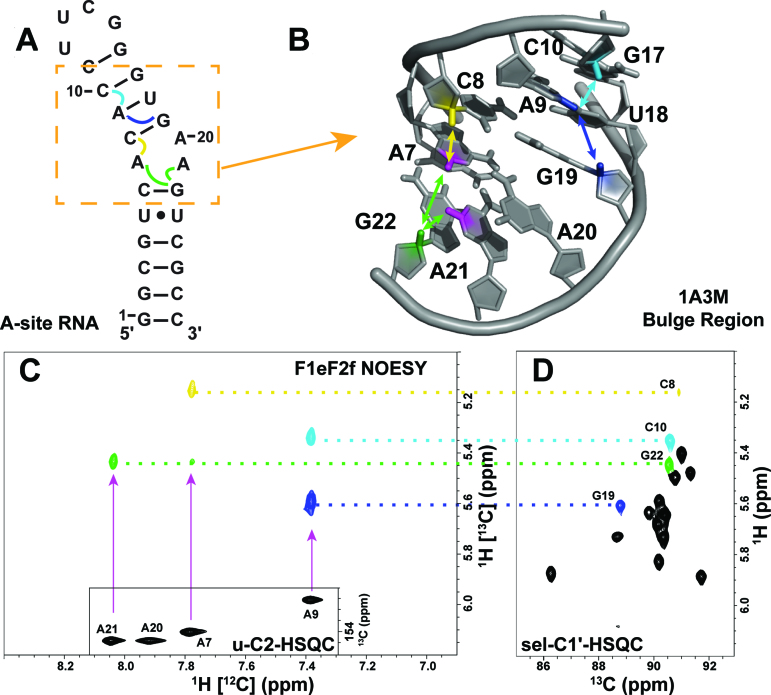
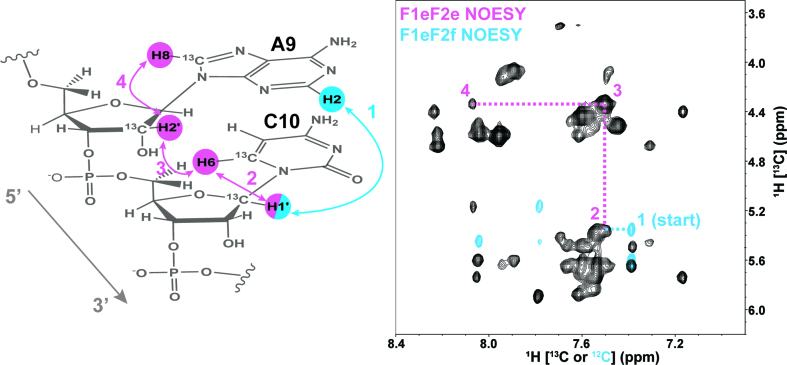
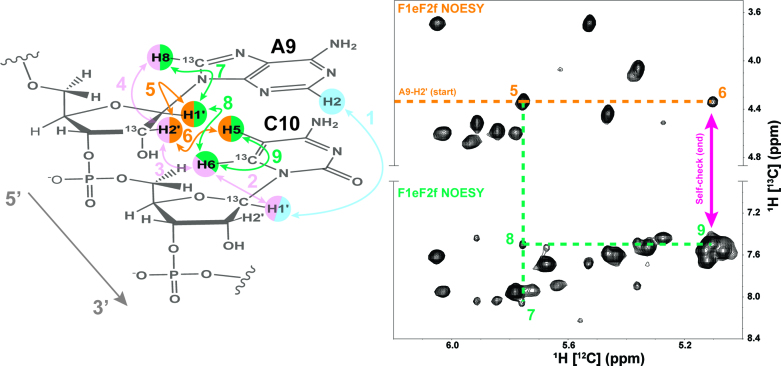
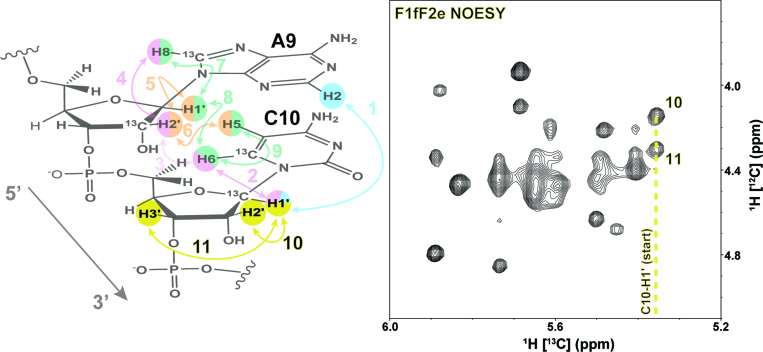
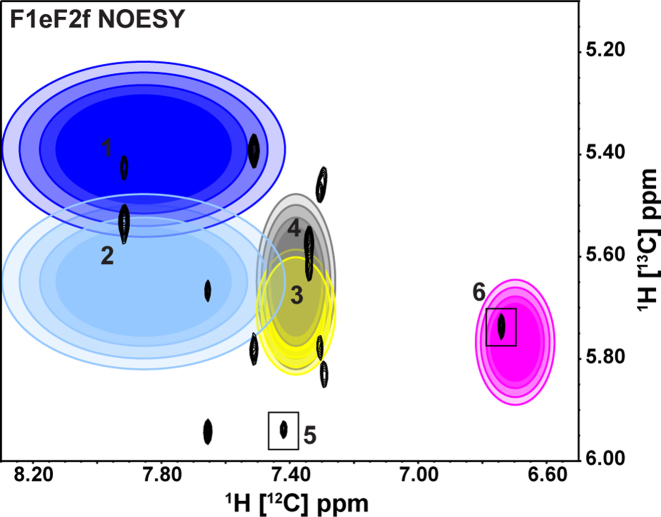
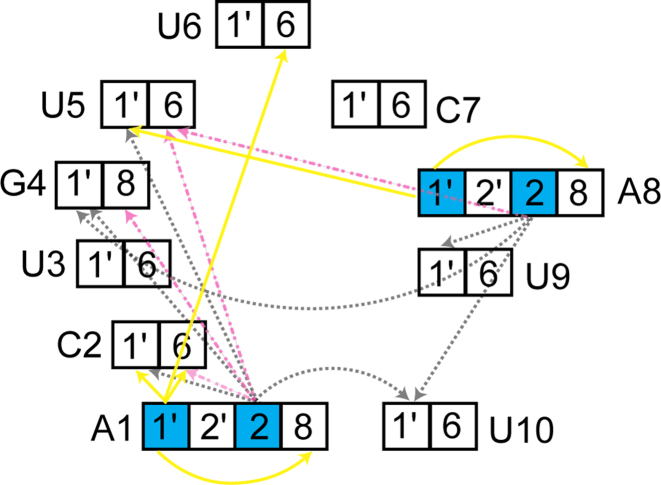
Although ∼98% of the human genomic output is transcribed as non-protein coding RNA, <2% of the protein data bank structures comprise RNA. This huge structural disparity stems from combined difficulties of crystallizing RNA for X-ray crystallography along with extensive chemical shift overlap and broadened linewidths associated with NMR of RNA. While half of the deposited RNA structures in the PDB were solved by NMR methods, the usefulness of NMR is still limited by the high cost of sample preparation and challenges of resonance assignment. Here we propose a novel strategy for resonance assignment that combines new strategic 13C labeling technologies with filter/edit type NOESY experiments to greatly reduce spectral complexity and crowding. This new strategy allowed us to assign important non-exchangeable resonances of proton and carbon (1', 2', 2, 5, 6 and 8) nuclei using only one sample and <24 h of NMR instrument time for a 27 nt model RNA. The method was further extended to assigning a 6 nt bulge from a 61 nt viral RNA element justifying its use for a wide range RNA chemical shift resonance assignment problems.


Figures

Figure 1.
Figure 1.
Following previously published methods, D-ribose-1-13C or D-ribose-2-13C was enzymatically coupled separately to 8-13C-guanine (32), 6-13C-1-15N-cytosine ((30, 31)), 8-13C-adenine, or 6-13C-1-15N-uracil which were then phosphorylated to their respective rNTPs. Atoms enriched with 13C are highlighted with purple circles and atoms enriched with 15N are indicated by orange squares. Purified NTPs were used to synthesize alternatively labeled RNA samples for NMR resonance assignment. Bacterial A-site RNA (27 nt) was transcribed from 2′,8-13C ATP, 1′,8-13C GTP, 2′,6-13C UTP, and 1′,6-13C CTP while the 61 nt viral RNA element was transcribed from 2′,8-13C ATP, 1′,8-13C GTP, 1′,6-13C-5-2H UTP, and 1′,6-13C-5-2H CTP. The common underlying method utilizes 2′,8-13C ATP for both RNAs as explained in the text.
Figure 2.
Figure 2.
Four separate NOESY spectra from the alternatively labeled bacterial A-site RNA with color coded regions labeled by expected proton cross-peaks (13C-label in black and 12C-label in gray) on the edge of each color coded region. Each spectrum is labeled by the dimension (F1 = indirect and F2 = direct) followed by the type of proton observed (a = all [13C-label and 12C-label], e = edited [13C-label], and f = filtered [12C-label]). The axis of each spectrum is also labeled by the type of observed proton resonance with the attached carbon isotope given in brackets. For example, the F1eF2e NOESY in the top right panel contains only cross-peaks from the 13C-labeled non-exchangeable protons. The color coded regions are as follows (white number): 1 = sky blue, 2 = reddish purple, 3 = orange, 4 = bluish green and 5 = yellow. The utility of these regions are described in detail within the text and the color and numbering of the highlighted regions correspond to the steps for logical resonance assignment.
Figure 3.
Figure 3.
The sequential NOESY ‘walk’ strategy is given as a step-by-step process color coded to match the regions of the NOESY spectra in Figure 2. Step 4 allows cross-validation of the assignments from the sequential NOESY ‘walk’ in step 2. A 3 bp region of the upper-stem of the 27 nt bacterial A-site RNA demonstrates the NOE cross-peaks expected from each of the NOESY regions in Figure 2. To simplify NOE cross-peaks, only non-exchangeable H1′, H2′, H2, H5, H6 and H8 atoms are labeled within this schematic figure and are color-coded by the spectral regions from which they were assigned.
Figure 4.
Figure 4.
(A) The secondary structure of A-site RNA with inter-nucleotide NOEs expected in the F1eF2f NOESY indicated with curly colored lines. The bulge region is highlighted with an orange dashed box. (B) The 3D structure of the bulge region with the A7-H2 (magenta), A9-H2 (dark blue), A21-H2 atoms (magenta) and their NOEs with C8-H1′ (yellow), C10-H1′ (light blue), G19-H1′ (dark blue) and G22-H1′ (green) marked with colored lines and arrows. (C) The sky blue region of the F1eF2f NOESY spectrum is depicted with an inset of the C2-H2 HSQC region of the uniformly labeled A-site RNA. Cross-peaks are colored to correlate with their C1′-H1′ partner in the C1′-H1′ HSQC of the alternatively labeled A-site sample (sel-C1′-HSQC). (D) Labeled peak assignments are connected by dotted color-coded lines to the corresponding ones in C.
Figure 5.
Figure 5.
The sequential NOESY ‘walk’ strategy for steps 1 and 2 is highlighted for the A9 and C10 stacked residues. All carbons are 12C labeled unless otherwise identified. The F1eF2f NOESY spectrum (sky blue peaks) is overlaid with the reddish purple F1eF2e NOESY region (black peaks) and includes the peaks labeled for each NOE connectivity (color coded and numbered to match NOESY spectrum) expected in the sequential A9-C10 example.
Figure 6.
Figure 6.
The sequential NOESY ‘walk’ for Steps 3 and 4 are color coded and numbered to match the peaks in the F1eF2f NOESY spectrum regions. Previous assignment steps are faded within the A9-C10 example for visual reference. The A9-H2′ starting point is labeled and follows the dotted orange line to peaks 5 and 6. Extension of the A9-H1′ assignment is marked by the dotted bluish-green line to peaks 7 (A9-H8) and 8 (C10-H6). Peak 9 from the C10-H6 to C10-H5 serves as a self-check with peak 6 (magenta arrow).
Figure 7.
Figure 7.
A schematic of the final assignment steps for unlabeled H2′ and H3′ from Step 5 of the logical assignment process with yellow highlighted arrows and numbers. The previous assignment steps and protons are faded for visual reference. The F1fF2e NOESY (yellow region) with starting point (C10-H1′) and cross-peaks to C10-H2′ and C10-H3′ are labeled 10 and 11, respectively.
Figure 8.
Figure 8.
The F1eF2f NOESY spectrum of a 61 nt hepadnaviral RNA element transcribed from 2′,8-13C ATP, 1′,8-13C GTP, 1′,6-13C-5-2H UTP and 1′,6-13C-5-2H CTP. All inter-nucleotide NOEs are observed for the A-H2 → H1′ (14 total peaks) arising from the eight A–U base-pairs found in the 61-nt viral RNA element. Two 5′-A form sets of stacked A-U base-pairs resulting in one observable inter-nucleotide NOE since the sequential 3′-A of the stacked A-U base-pair does not contain a 13C-labeled H1′. Peaks ( and 6) from these unique 5′-A within A–U stacked base-pairs are highlighted with black boxes. Additional starting points (peaks 1–4 and 6) are highlighted with colored ellipses with increasing radii representing 68, 80, 90 and 95% probabilities for predicted NOE cross-peak using NMRViewJ chemical shift prediction resulting in a total of six unambiguous starting points (39).
Figure 9.
Figure 9.
A 6 nt bulge from the 61 nt hepadnaviral RNA element was assigned using a F1eF2f NOESY experiment. In helical regions, well defined contacts are seen from the H2 of adenine to a number of H1′ residues. However, in the bulge, the versatility of our labeling scheme is realized. The RNA was labeled with 1′,8-13C GTP, 2′,8-13C ATP, 1′,6-13C-5-2H UTP, and 1′,6-13C-5-2H CTP. Protons attached to 12C nuclei are highlighted in cyan. During the F1eF2f NOESY experiment three classes of cross-peaks were defined. H2 to G/U/C H1′ contacts are depicted in grey dotted lines. H2 to base (H6/H8) contacts are shown in dot/dash magenta lines. Finally, adenine H1′ to both base and sugar are shown as solid yellow.

References

    1. Breaker R.R. Prospects for riboswitch discovery and analysis. Mol. Cell. 2011; 43:867–879. - PMC - PubMed
    1. Mattick J.S. A new paradigm for developmental biology. J. Exp. Biol. 2007; 210:1526–1547. - PubMed
    1. Serganov A., Nudler E.. A decade of riboswitches. Cell. 2013; 152:17–24. - PMC - PubMed
    1. Steitz T.A. A structural understanding of the dynamic ribosome machine. Nat. Rev. Mol. Cell Biol. 2008; 9:242–253. - PubMed
    1. Ramakrishnan V. The ribosome emerges from a black box. Cell. 2014; 159:979–984. - PubMed