. 2017 Sep 19;45(16):9290-9301.
doi: 10.1093/nar/gkx706.

A comprehensive, cell specific microRNA catalogue of human peripheral blood

Affiliations

A comprehensive, cell specific microRNA catalogue of human peripheral blood

Simonas Juzenas et al. Nucleic Acids Res. .

Abstract

With this study, we provide a comprehensive reference dataset of detailed miRNA expression profiles from seven types of human peripheral blood cells (NK cells, B lymphocytes, cytotoxic T lymphocytes, T helper cells, monocytes, neutrophils and erythrocytes), serum, exosomes and whole blood. The peripheral blood cells from buffy coats were typed and sorted using FACS/MACS. The overall dataset was generated from 450 small RNA libraries using high-throughput sequencing. By employing a comprehensive bioinformatics and statistical analysis, we show that 3' trimming modifications as well as composition of 3' added non-templated nucleotides are distributed in a lineage-specific manner-the closer the hematopoietic progenitors are, the higher their similarities in sequence variation of the 3' end. Furthermore, we define the blood cell-specific miRNA and isomiR expression patterns and identify novel cell type specific miRNA candidates. The study provides the most comprehensive contribution to date towards a complete miRNA catalogue of human peripheral blood, which can be used as a reference for future studies. The dataset has been deposited in GEO and also can be explored interactively following this link: http://134.245.63.235/ikmb-tools/bloodmiRs.


Figures

Figure 1.
Figure 1.
Simplified human hematopoietic tree of different cell compounds (modified from Häggström (69)). The miRNA expression profiles were generated for natural killer (NK) cell (CD56+), B lymphocyte (CD19+), cytotoxic T cell (CD8+), T helper cell (CD4+), monocyte (CD14+), neutrophil (CD15+) and erythrocyte (CD235a+) populations (highlighted in red).
Figure 2.
Figure 2.
The presence of miRNAs in erythrocytes (RBCs), exosomes and serum. The barplot shows the log2 transformed median read counts of the most abundant miRNAs in RBCs. The heatmap represents presence (blue) or absence (red) of miRNAs in specific blood compounds. Only the miRNAs which were detected (expression value > 5) in at least 85% of the samples in at least one of the blood compound were considered as being present.
Figure 3.
Figure 3.
The distributions of isomiR modification types across different blood compounds. (A) 5′ end trimming modification distribution; (B) 3′ end trimming modification distribution; (C) nucleotide substitution modification distribution; (D) 3′ end addition modification distribution. Each dot represents individual sample colored by group. The size of dots indicates the abundance which corresponds to the relative number of molecule copies per modification type and position present in a given sample. The dash (–) symbol indicates the mean frequency of unique sequences per group. The smoothing in figure C was performed using the generalized additive model (GAM) method.
Figure 4.
Figure 4.
The composition of 3′ added nucleotides across the blood compounds. A hierarchical average linkage clustering was used to generate a dendrogram based on relative frequencies of bases per position of the unique sequences, which then were visualized as sequence logos.
Figure 5.
Figure 5.
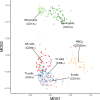
The similarity structure of human blood cell miRNA transcriptomes. MDS plot showing three clearly resolved clusters corresponding to lymphoid cells (NK cells, B cells, T cells and Th cells), myeloid cells (monocytes and neutrophils) and anucleate erythrocytes. The analysis was performed on miRNA count data using Spearman's correlation distance (1 – correlation coefficient). The dots represent samples coloured by group, while the centre of ellipses corresponds to the group mean and the shapes are defined by the covariance within group.
Figure 6.
Figure 6.
(A) Differentially expressed miRNAs between lymphoid and myeloid cell lineage; (B) expression levels of blood cell lineage-specific miRNAs. Each row of the heatmaps represents a sample corresponding to the one of the blood cell types, and each column represents an individual miRNA-arm. All miRNAs were statistically differentially expressed (FDR ≤ 0.001 and |log2FC| > 1). The Z-score in the heatmaps represents standardized normalized expression values. The unsupervised (agglomerative) hierarchical clustering of miRNAs was performed using Spearman's correlation distance (1 – correlation coefficient) as metric and average linkage clustering as linkage criterion.

References

    1. Bartel D.P. MicroRNAs: genomics, biogenesis, mechanism, and function. Cell. 2004; 116:281–297. - PubMed
    1. Kozomara A., Griffiths-Jones S.. miRBase: annotating high confidence microRNAs using deep sequencing data. Nucleic Acids Res. 2014; 42:D68–D73. - PMC - PubMed
    1. Lewis B.P., Burge C.B., Bartel D.P.. Conserved seed pairing, often flanked by adenosines, indicates that thousands of human genes are microRNA targets. Cell. 2005; 120:15–20. - PubMed
    1. Friedman R.C., Farh K.K.-H., Burge C.B., Bartel D.P.. Most mammalian mRNAs are conserved targets of microRNAs. Genome Res. 2009; 19:92–105. - PMC - PubMed
    1. Iorio M. V., Ferracin M., Liu C.-G., Veronese A., Spizzo R., Sabbioni S., Magri E., Pedriali M., Fabbri M., Campiglio M. et al. . MicroRNA gene expression deregulation in human breast cancer. Cancer Res. 2005; 65:7065–7070. - PubMed