

Exposure to Road, Railway, and Aircraft Noise and Arterial Stiffness in the SAPALDIA Study: Annual Average Noise Levels and Temporal Noise Characteristics
- PMID: 28934719
- PMCID: PMC5915209
- DOI: 10.1289/EHP1136
Exposure to Road, Railway, and Aircraft Noise and Arterial Stiffness in the SAPALDIA Study: Annual Average Noise Levels and Temporal Noise Characteristics
Abstract
Background: The impact of different transportation noise sources and noise environments on arterial stiffness remains unknown.
Objectives: We evaluated the association between residential outdoor exposure to annual average road, railway, and aircraft noise levels, total noise intermittency (IR), and total number of noise events (NE) and brachial-ankle pulse wave velocity (baPWV) following a cross-sectional design.
Methods: We measured baPWV (meters/second) in 2,775 participants (49-81 y old) at the second follow-up (2010-2011) of the Swiss Cohort Study on Air Pollution and Lung and Heart Diseases in Adults (SAPALDIA). We assigned annual average road, railway, and aircraft noise levels (Ldensource), total day- and nighttime NEtime and IRtime (percent fluctuation=0%, none or constant noise; percent fluctuation=100%, high fluctuation) at the most exposed façade using 2011 Swiss noise models. We applied multivariable linear mixed regression models to analyze associations.
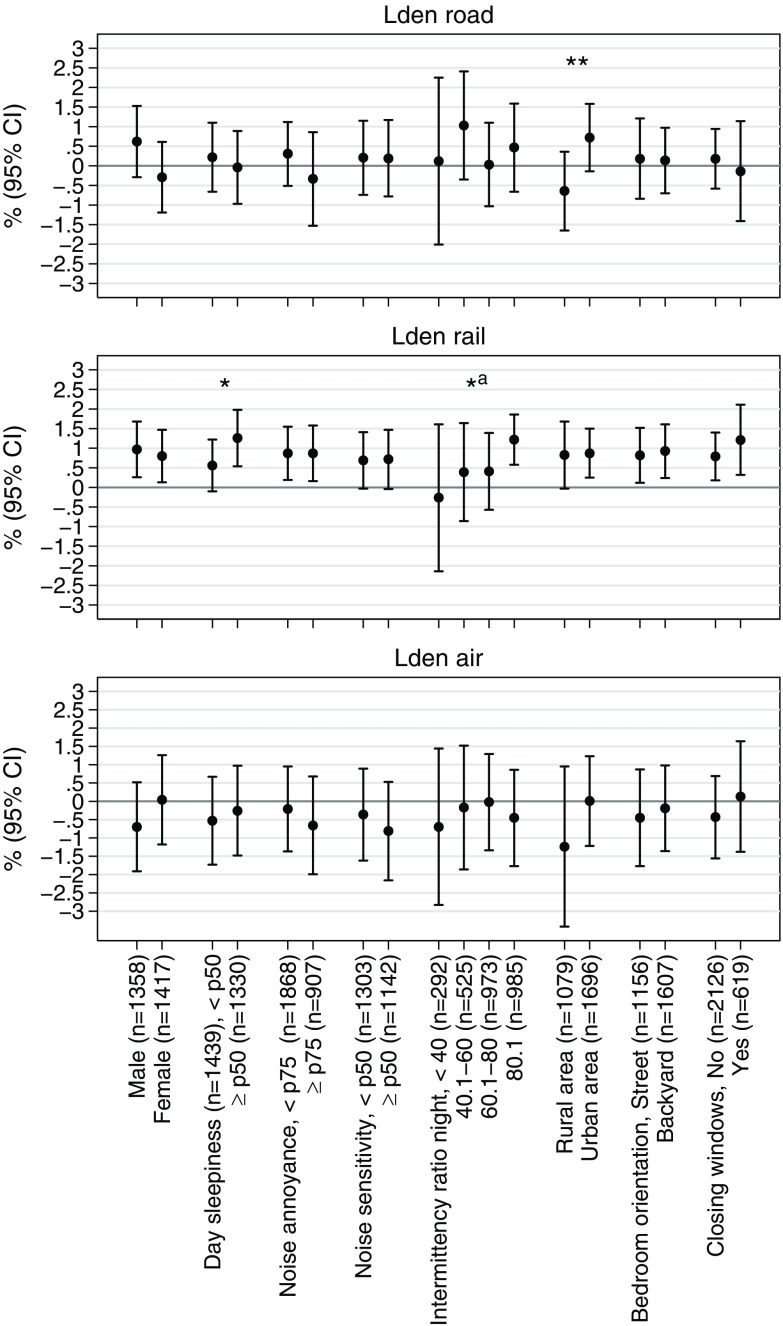
Results: Medians [interquartile ranges (IQRs)] were baPWV=13.4 (3.1) m/s; Ldenair (57.6% exposed)=32.8 (8.0) dB; Ldenrail (44.6% exposed)=30.0 (8.1) dB; Ldenroad (99.7% exposed): 54.2 (10.6) dB; NEnight=123 (179); NEday=433 (870); IRnight=73% (27); and IRday=63.8% (40.3). We observed a 0.87% (95% CI: 0.31, 1.43%) increase in baPWV per IQR of Ldenrail, which was greater with IRnight>80% or with daytime sleepiness. We observed a nonsignificant positive association between Ldenroad and baPWV in urban areas and a negative tendency in rural areas. NEnight, but not NEday, was associated with baPWV. Associations were independent of the other noise sources and air pollution.
Conclusions: Long-term exposure to railway noise, particularly in an intermittent nighttime noise environment, and to nighttime noise events, mainly related to road noise, may affect arterial stiffness, a major determinant of cardiovascular disease. Ascertaining noise exposure characteristics beyond average noise levels may be relevant to better understand noise-related health effects. https://doi.org/10.1289/EHP1136.
Figures
Comment in
-
Not All Noise Is the Same: Fluctuations in Transportation Noise Levels and Arterial Stiffness.Environ Health Perspect. 2018 Jan 31;126(1):014004. doi: 10.1289/EHP2477. Environ Health Perspect. 2018. PMID: 29389660 No abstract available.
Similar articles
-
Long-term exposure to transportation noise and air pollution in relation to incident diabetes in the SAPALDIA study.Int J Epidemiol. 2017 Aug 1;46(4):1115-1125. doi: 10.1093/ije/dyx020. Int J Epidemiol. 2017. PMID: 28338949 Free PMC article.
-
Is physical activity a modifier of the association between air pollution and arterial stiffness in older adults: The SAPALDIA cohort study.Int J Hyg Environ Health. 2017 Aug;220(6):1030-1038. doi: 10.1016/j.ijheh.2017.06.001. Epub 2017 Jun 13. Int J Hyg Environ Health. 2017. PMID: 28629640
-
Transportation noise exposure and cardiovascular mortality: a nationwide cohort study from Switzerland.Eur J Epidemiol. 2017 Apr;32(4):307-315. doi: 10.1007/s10654-017-0234-2. Epub 2017 Mar 9. Eur J Epidemiol. 2017. PMID: 28280950
-
Brachial-Ankle Pulse Wave Velocity and the Risk Prediction of Cardiovascular Disease: An Individual Participant Data Meta-Analysis.Hypertension. 2017 Jun;69(6):1045-1052. doi: 10.1161/HYPERTENSIONAHA.117.09097. Epub 2017 Apr 24. Hypertension. 2017. PMID: 28438905 Review.
-
Years of life lost and morbidity cases attributable to transportation noise and air pollution: A comparative health risk assessment for Switzerland in 2010.Int J Hyg Environ Health. 2015 Aug;218(6):514-21. doi: 10.1016/j.ijheh.2015.05.003. Epub 2015 May 11. Int J Hyg Environ Health. 2015. PMID: 26003939 Review.
Cited by
-
The Cardiovascular Effects of Noise.Dtsch Arztebl Int. 2019 Apr 5;116(14):245-250. doi: 10.3238/arztebl.2019.0245. Dtsch Arztebl Int. 2019. PMID: 31092312 Free PMC article. Review.
-
Long-term exposure to road traffic noise and stroke incidence: a Danish Nurse Cohort study.Environ Health. 2021 Nov 6;20(1):115. doi: 10.1186/s12940-021-00802-2. Environ Health. 2021. PMID: 34740347 Free PMC article.
-
Midregional pro atrial natriuretic peptide: a novel important biomarker for noise annoyance-induced cardiovascular morbidity and mortality?Clin Res Cardiol. 2021 Jan;110(1):29-39. doi: 10.1007/s00392-020-01645-6. Epub 2020 Apr 18. Clin Res Cardiol. 2021. PMID: 32306084 Free PMC article.
-
The contribution of the exposome to the burden of cardiovascular disease.Nat Rev Cardiol. 2023 Oct;20(10):651-669. doi: 10.1038/s41569-023-00873-3. Epub 2023 May 10. Nat Rev Cardiol. 2023. PMID: 37165157 Review.
-
Long-term noise exposures and cardiovascular diseases mortality: A study in 5 U.S. states.Environ Res. 2024 Mar 15;245:118092. doi: 10.1016/j.envres.2023.118092. Epub 2023 Dec 30. Environ Res. 2024. PMID: 38163540 Free PMC article.
References
-
- Ackermann-Liebrich U, Kuna-Dibbert B, Probst-Hensch NM, Schindler C, Felber Dietrich D, Stutz EZ, et al. 2005. Follow-up of the Swiss Cohort Study on Air Pollution and Lung Diseases in Adults (SAPALDIA 2) 1991-2003: methods and characterization of participants. Soz-Präventivmed 50:245–263, 10.1007/s00038-005-4075-5. - DOI - PubMed
-
- Babisch W. 2002. The noise/stress concept, risk assessment and research needs. Noise Health 4(16):1–11, PMID: 12537836. - PubMed
-
- Babisch W. 2003. Stress hormones in the research on cardiovascular effects of noise. Noise Health 5(18):1–11, PMID: 12631430. - PubMed
Publication types
MeSH terms
Grants and funding
LinkOut - more resources
Full Text Sources
Other Literature Sources
Miscellaneous
