

Age and sex corrected normal reference values of T1, T2 T2* and ECV in healthy subjects at 3T CMR
- PMID: 28934962
- PMCID: PMC5609021
- DOI: 10.1186/s12968-017-0371-5
Age and sex corrected normal reference values of T1, T2 T2* and ECV in healthy subjects at 3T CMR
Abstract
Background: Myocardial T1, T2 and T2* imaging techniques become increasingly used in clinical practice. While normal values for T1, T2 and T2* times are well established for 1.5 Tesla (T) cardiovascular magnetic resonance (CMR), data for 3T remain scarce. Therefore we sought to determine normal reference values relative to gender and age and day to day reproducibility for native T1, T2, T2* mapping and extracellular volume (ECV) at 3T in healthy subjects.
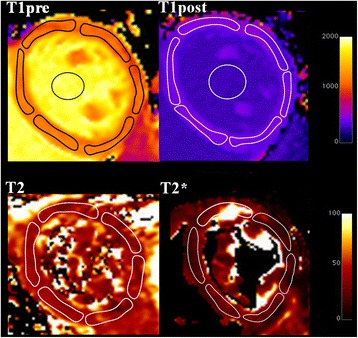
Methods: After careful exclusion of cardiovascular abnormality, 75 healthy subjects aged 20 to 90 years old (mean 56 ± 19 years, 47% women) underwent left-ventricular T1 (3-(3)-3-(3)-5 MOLLI)), T2 (8 echo- spin echo-imaging) and T2 * (8 echo gradient echo imaging) mapping at 3T CMR (Philips Ingenia 3T and computation of extracellular volume after administration of 0.2 mmol/kg Gadovist). Inter- and intra-observer reproducibility was estimated by intraclass correlation coefficient (ICC). Day to day reproducibility was assessed in 10 other volunteers.
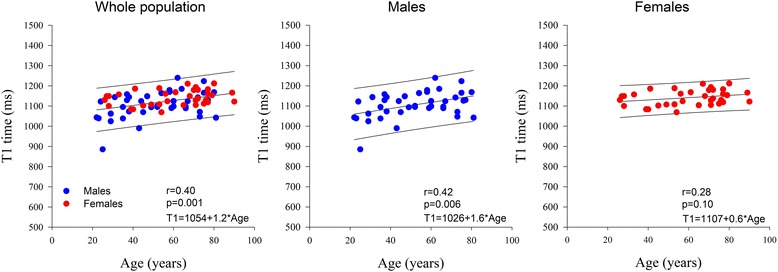
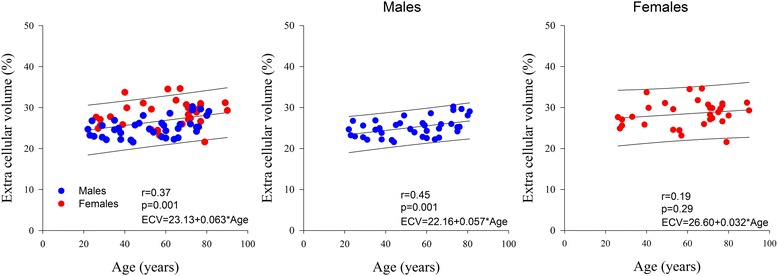
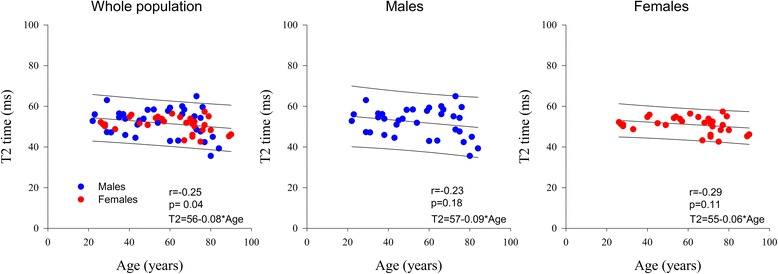
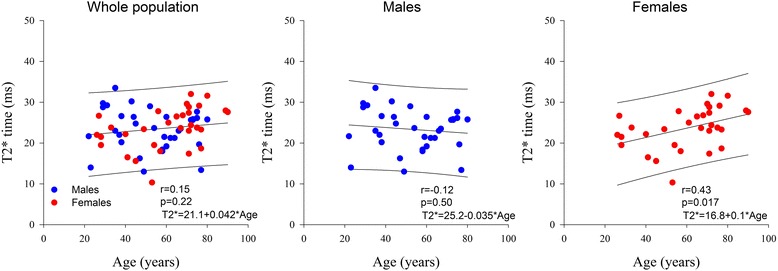
Results: Mean myocardial T1 at 3T was 1122 ± 57 ms, T2 52 ± 6 ms, T2* 24 ± 5 ms and ECV 26.6 ± 3.2%. T1 (1139 ± 37 vs 1109 ± 73 ms, p < 0.05) and ECV (28 ± 3 vs 25 ± 2%, p < 0.001), but not T2 (53 ± 8 vs 51 ± 4, p = NS) were significantly greater in age matched women than in men. T1 (r = 0.40, p < 0.001) and ECV (r = 0.37, p = 0.001) increased, while T2 decreased significantly (r = -0.25, p < 0.05) with increasing age. T2* was not influenced by either gender or age. Intra and inter-observer reproducibility was high (ICC ranging between 0.81-0.99), and day to day coefficient of variation was low (6.2% for T1, 7% for T2, 11% for T2* and 11.5% for ECV).
Conclusions: We provide normal myocardial T2, T2*,T1 and ECV reference values for 3T CMR which are significantly different from those reported at 1.5 Tesla CMR. Myocardial T1 and ECV values are gender and age dependent. Measurement had high inter and intra-observer reproducibility and good day-to-day reproducibility.
Keywords: 3 T; Extracellular volume; Normal values; T1 mapping; T2 mapping; T2* mapping.
Conflict of interest statement
Ethics approval and consent to participate
The study was approved by the IRB of the Cliniques St. Luc, Université Catholique de Louvain and all participants gave written permission to participating in the study.
Consent for publication
NA
Competing interests
The Cliniques St. Luc UCL has a master clinical research agreement with Philips Medical Instruments, and the MOLLI patch was supplied by Philips Medical under the terms of this agreement.
Publisher’s Note
Springer Nature remains neutral with regard to jurisdictional claims in published maps and institutional affiliations.
Figures
References
-
- Captur G, Manisty C, Moon JC. Cardiac MRI evaluation of myocardial disease. Heart (British Cardiac Society) 2016 doi:10.1136/heartjnl-2015-309077 [published Online First: 2016/06/30]. - PubMed
-
- Roller FC, Harth S, Schneider C, et al. T1, T2 mapping and extracellular volume fraction (ECV): application, value and further perspectives in myocardial inflammation and Cardiomyopathies. RoFo: Fortschritte auf dem Gebiete der Rontgenstrahlen und der Nuklearmedizin 2015; 187(9):760-770. doi:10.1055/s-0034-1399546 [published Online First: 2015/06/23]. - PubMed
-
- Kammerlander AA, Marzluf BA, Zotter-Tufaro C, et al. T1 mapping by CMR imaging: from histological validation to clinical implication. JACC Cardiovascular imaging 2016; 9(1):14-23. doi:10.1016/j.jcmg.2015.11.002 [published Online First: 2015/12/20]. - PubMed
-
- Nassenstein K, Nensa F, Schlosser T, et al. Cardiac MRI: T2-mapping versus T2-weighted dark-blood TSE imaging for myocardial Edema visualization in acute myocardial infarction. RoFo: Fortschritte auf dem Gebiete der Rontgenstrahlen und der Nuklearmedizin 2014; 186(2):166-172. doi: 10.1055/s-0033-1350516 [published Online First: 2013/10/02]. - PubMed
MeSH terms
LinkOut - more resources
Full Text Sources
Other Literature Sources
Medical
Miscellaneous
