. 2017 Sep 21;18(1):182.
doi: 10.1186/s13059-017-1299-7.

Comprehensive benchmarking and ensemble approaches for metagenomic classifiers

Affiliations

Comprehensive benchmarking and ensemble approaches for metagenomic classifiers

Alexa B R McIntyre et al. Genome Biol. .

Erratum in

Abstract

Background: One of the main challenges in metagenomics is the identification of microorganisms in clinical and environmental samples. While an extensive and heterogeneous set of computational tools is available to classify microorganisms using whole-genome shotgun sequencing data, comprehensive comparisons of these methods are limited.

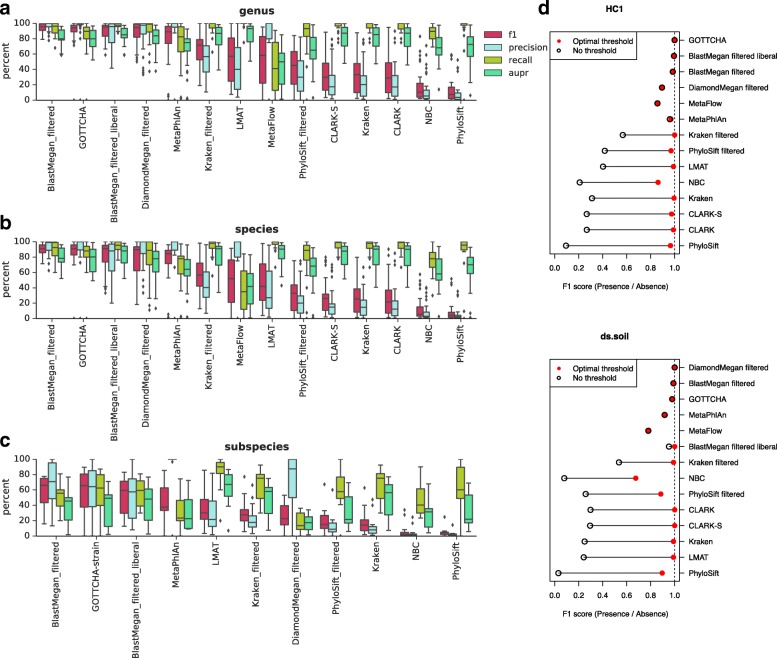
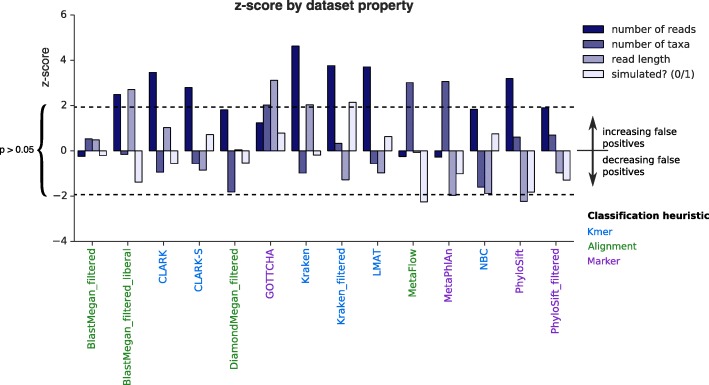
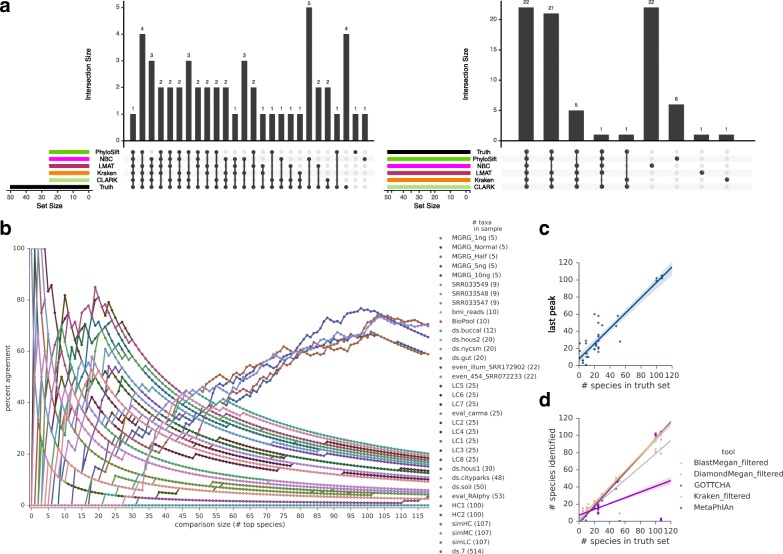
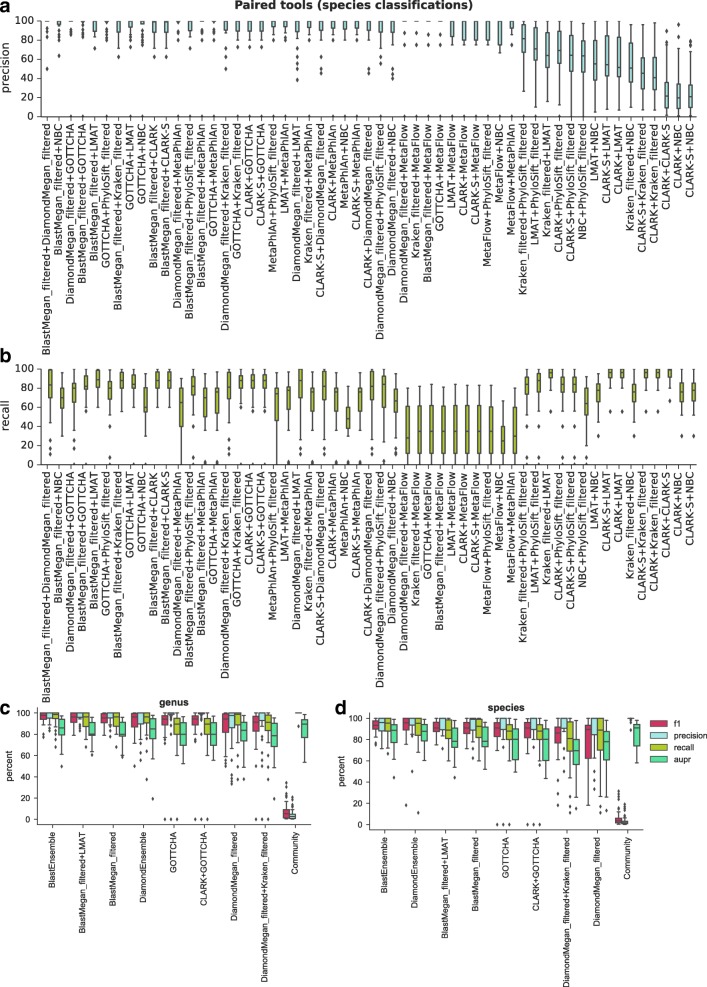
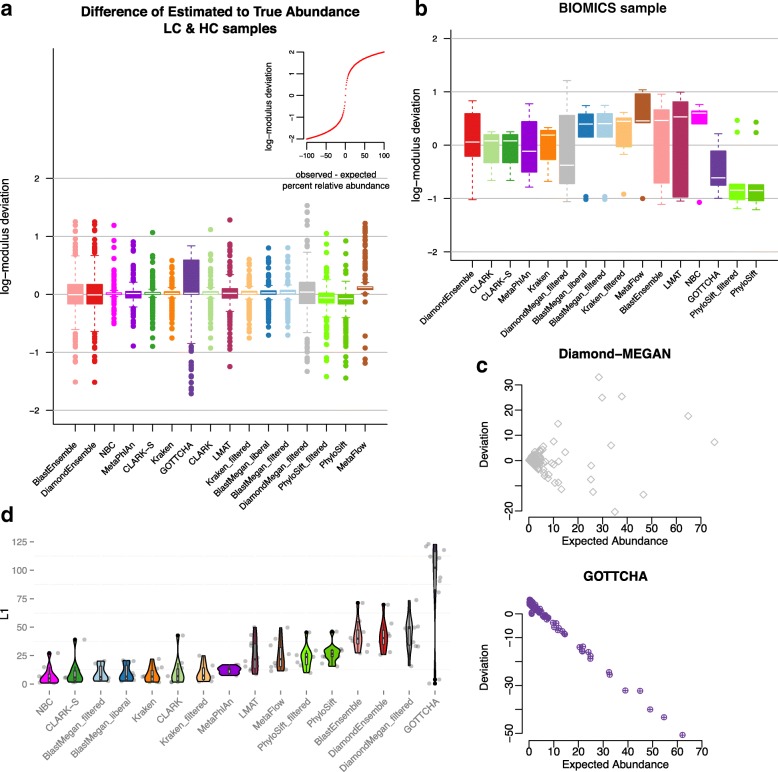
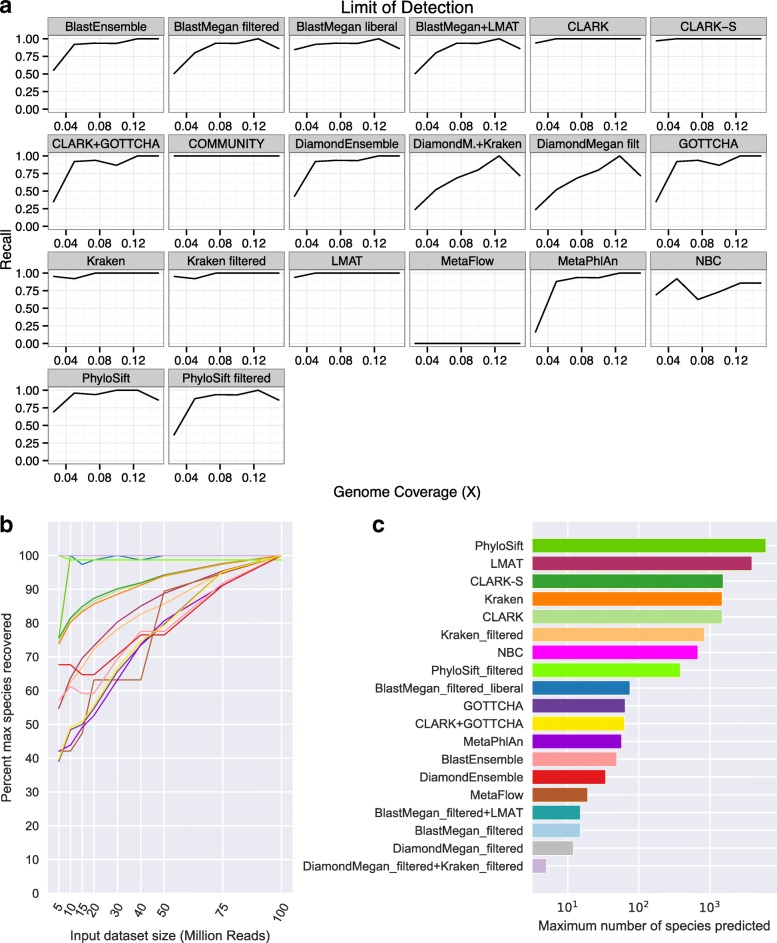
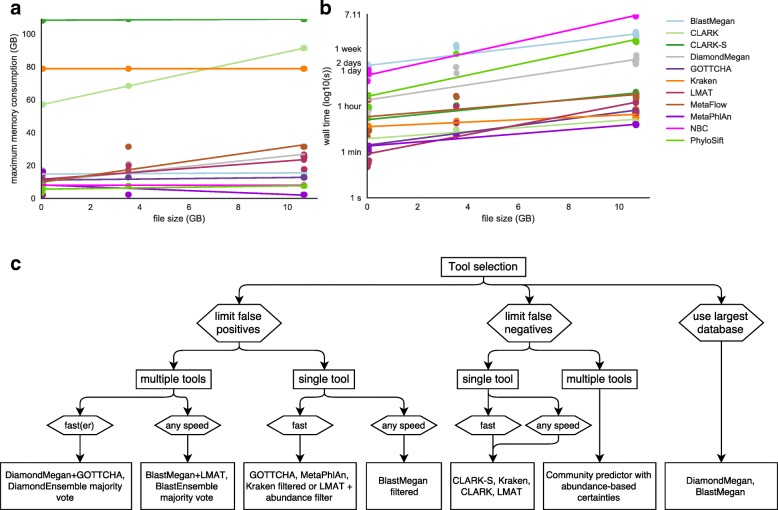
Results: In this study, we use the largest-to-date set of laboratory-generated and simulated controls across 846 species to evaluate the performance of 11 metagenomic classifiers. Tools were characterized on the basis of their ability to identify taxa at the genus, species, and strain levels, quantify relative abundances of taxa, and classify individual reads to the species level. Strikingly, the number of species identified by the 11 tools can differ by over three orders of magnitude on the same datasets. Various strategies can ameliorate taxonomic misclassification, including abundance filtering, ensemble approaches, and tool intersection. Nevertheless, these strategies were often insufficient to completely eliminate false positives from environmental samples, which are especially important where they concern medically relevant species. Overall, pairing tools with different classification strategies (k-mer, alignment, marker) can combine their respective advantages.

Conclusions: This study provides positive and negative controls, titrated standards, and a guide for selecting tools for metagenomic analyses by comparing ranges of precision, accuracy, and recall. We show that proper experimental design and analysis parameters can reduce false positives, provide greater resolution of species in complex metagenomic samples, and improve the interpretation of results.

Keywords: Classification; Comparison; Ensemble methods; Meta-classification; Metagenomics; Pathogen detection; Shotgun sequencing; Taxonomy.


Conflict of interest statement

Consent for publication

All NA12878 human data are consented for publication.

Competing interests

Some authors (listed above) are members of commercial operations in metagenomics, including IBM, CosmosID, Biotia, and One Codex.

Publisher’s Note

Springer Nature remains neutral with regard to jurisdictional claims in published maps and institutional affiliations.

Figures

Fig. 1
Fig. 1
The F1 score, precision, recall, and AUPR (where tools are sorted by decreasing mean F1 score) across datasets with available truth sets for taxonomic classifications at the (a) genus (35 datasets), (b) species (35 datasets), and (c) subspecies (12 datasets) levels. d The F1 score changes depending on relative abundance thresholding, as shown for two datasets. The upper bound in red marks the optimal abundance threshold to maximize F1 score, adjusted for each dataset and tool. The lower bound in black indicates the F1 score for the output without any threshold. Results are sorted by the difference between upper and lower bounds
Fig. 2
Fig. 2
Number of false positives called by different tools as a function of dataset features. The test statistic (z-score) for each feature is reported after fitting a negative binomial model, with p value > 0.05 within the dashed lines and significant results beyond
Fig. 3
Fig. 3
Combining results from imprecise tools can predict the true number of species in a dataset. a UpSet plots of the top-X (by abundance) species uniquely found by a classifier or group of classifiers (grouped by black dots at bottom, unique overlap sizes in the bar charts above). The eval_RAIphy dataset is presented as an example, with comparison sizes X = 25 and X = 50. The percent overlap, calculated as the number of species overlapping between all tools, divided by the number of species in the comparison, increases around the number of species in the sample (50 in this case). b The percent overlaps for all datasets show a similar trend. c The rightmost peak in (b) approximates the number of species in a sample, with a root mean square error (RMSE) of 8.9 on the test datasets. d Precise tools can offer comparable or better estimates of species count. RMSE = 3.2, 3.8, 3.9, 12.2, and 32.9 for Kraken filtered, BlastMegan filtered, GOTTCHA, Diamond-MEGAN filtered, and MetaPhlAn2, respectively
Fig. 4
Fig. 4
The (a) precision and (b) recall for intersections of pairs of tools at the species level, sorted by decreasing mean precision. A comparison between multi-tool strategies and combinations at the (c) genus and (d) species levels. The top unique (non-overlapping) pairs of tools by F1 score from (a, b) are benchmarked against the top single tools at the species level by F1 score, ensemble classifiers that take the consensus of four or five tools (see “Methods”), and a community predictor that incorporates the results from all 11 tools in the analysis to improve AUPR
Fig. 5
Fig. 5
The relative abundances of species detected by tools compared to their known abundances for (a) simulated datasets and (b) a biological dataset, sorted by median log-modulus difference (difference' = sign(difference)*log(1 + |difference|)). Most differences between observed and expected abundances fell between 0 and 10, with a few exceptions (see inset for scale). c The deviation between observed and expected abundance by expected percent relative abundance for two high variance tools on the simulated data. While most tools, like Diamond-MEGAN, did not show a pattern in errors, GOTTCHA overestimated low-abundance species and underestimated high-abundance species in the log-normally distributed data. d The L1 distances between observed and expected abundances show the consistency of different tools across simulated datasets
Fig. 6
Fig. 6
a Recall at varying levels of genome coverage on the HC and LC datasets (using the least filtered sets of results for each tool). b Downsampling a highly sequenced environmental sample shows depth of sequencing significantly affects results for specific tools, expressed as a percentage of the maximum number of species detected. Depending on strategy, filters can decrease the changes with depth. c The maximum number of species detected by each tool at any depth
Fig. 7
Fig. 7
a Time and (b) maximum memory consumption running the tools on a subset of data using 16 threads (where the option was available, except for PhyloSift, which failed to run using more than one thread, and NBC, which was run through the online server using four threads). BLAST, NBC, and PhyloSift were too slow to completely classify the larger datasets, therefore subsamples were taken and time multiplied. c A decision tree summary of recommendations based on the results of this analysis

References

    1. Morgan XC, Tickle TL, Sokol H, Gevers D, Devaney KL, Ward DV, et al. Dysfunction of the intestinal microbiome in inflammatory bowel disease and treatment. Genome Biol. 2012;13:R79. doi: 10.1186/gb-2012-13-9-r79. - DOI - PMC - PubMed
    1. Tighe S, Afshinnekoo A, Rock TM, McGrath K, Alexander N. Genomic methods and microbiological technologies for profiling novel and extreme environments for the Extreme Microbiome Project (XMP) J Biomol Tech. 2017;28(2):93. doi: 10.7171/jbt.17-2801-004CX. - DOI - PMC - PubMed
    1. Rose JB, Epstein PR, Lipp EK, Sherman BH, Bernard SM, Patz JA. Climate variability and change in the United States: potential impacts on water-and foodborne diseases caused by microbiologic agents. Environ Health Perspect. 2001;109:211. doi: 10.2307/3435011. - DOI - PMC - PubMed
    1. Verde C, Giordano D, Bellas C, di Prisco G, Anesio A. Chapter Four - Polar marine microorganisms and climate change. Adv Microb Physiol. 2016;69:187–215. doi: 10.1016/bs.ampbs.2016.07.002. - DOI - PubMed
    1. The Human Microbiome Jumpstart Reference Strains Consortium. Nelson KE, Weinstock GM, Highlander SK, Worley KC, Creasy HH, et al. A catalog of reference genomes from the human microbiome. Science. 2010;328:994–9. doi: 10.1126/science.1183605. - DOI - PMC - PubMed

Publication types