. 2018 Aug 15:471:105-117.
doi: 10.1016/j.mce.2017.09.024. Epub 2017 Sep 19.

Integrated molecular analysis of Tamoxifen-resistant invasive lobular breast cancer cells identifies MAPK and GRM/mGluR signaling as therapeutic vulnerabilities

Affiliations

Integrated molecular analysis of Tamoxifen-resistant invasive lobular breast cancer cells identifies MAPK and GRM/mGluR signaling as therapeutic vulnerabilities

Hillary Stires et al. Mol Cell Endocrinol. .

Abstract

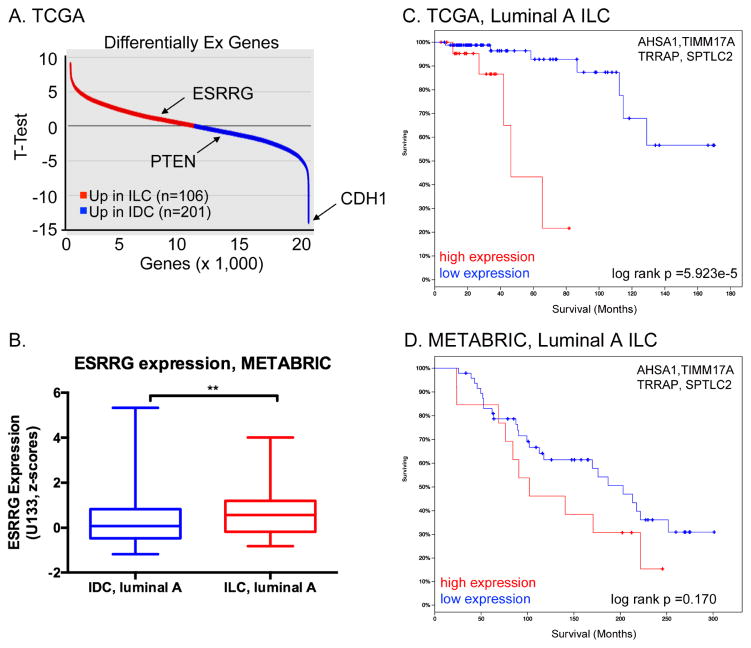
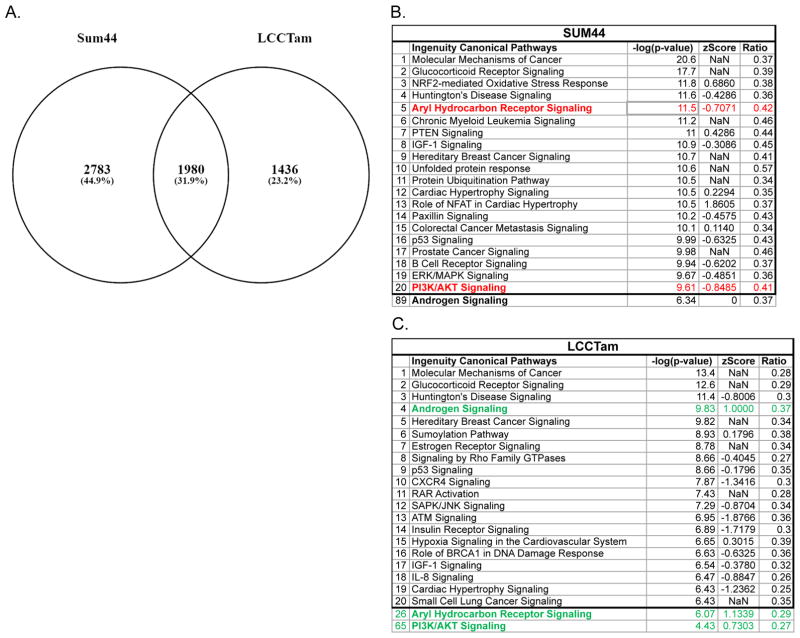
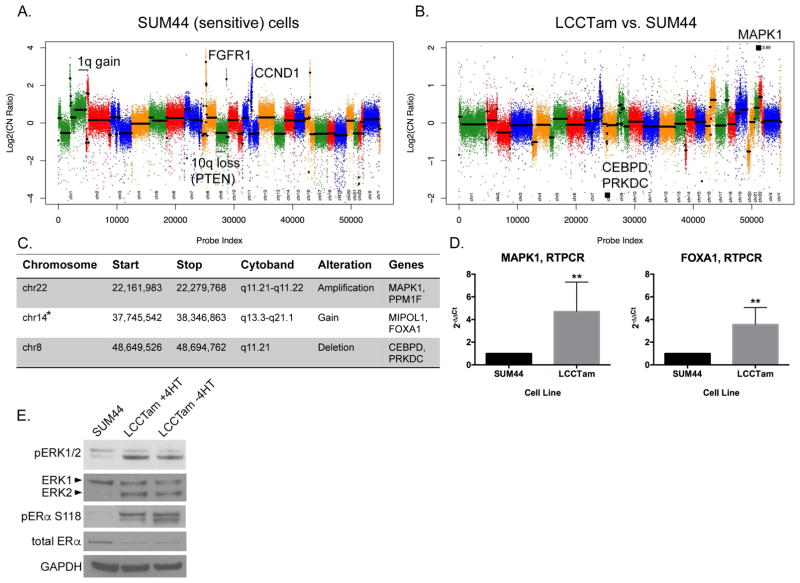
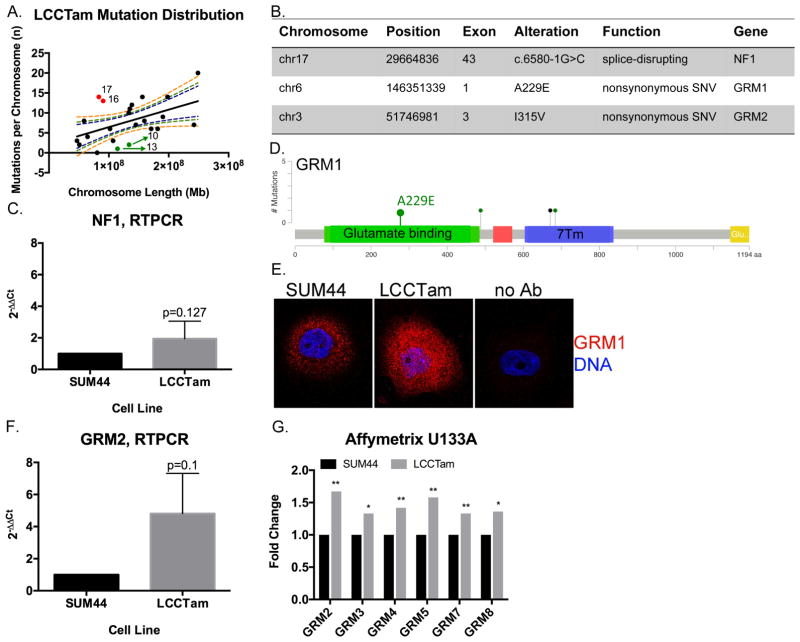
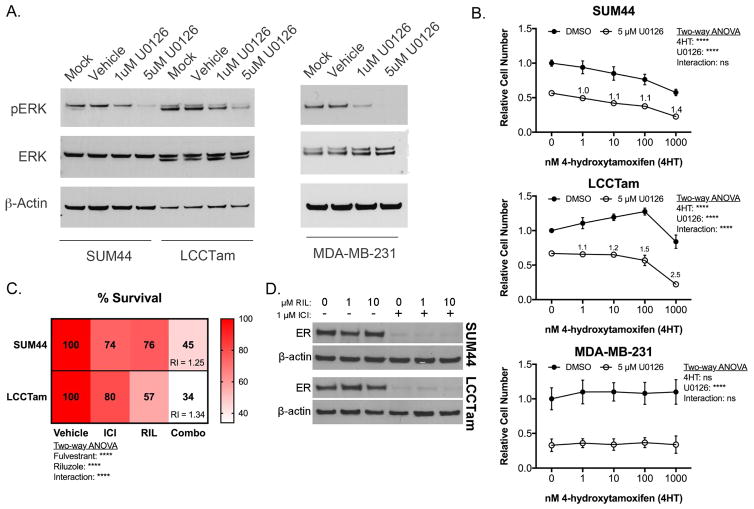
Invasive lobular breast cancer (ILC) is an understudied malignancy with distinct clinical, pathological, and molecular features that distinguish it from the more common invasive ductal carcinoma (IDC). Mounting evidence suggests that estrogen receptor-alpha positive (ER+) ILC has a poor response to Tamoxifen (TAM), but the mechanistic drivers of this are undefined. In the current work, we comprehensively characterize the SUM44/LCCTam ILC cell model system through integrated analysis of gene expression, copy number, and mutation, with the goal of identifying actionable alterations relevant to clinical ILC that can be co-targeted along with ER to improve treatment outcomes. We show that TAM has several distinct effects on the transcriptome of LCCTam cells, that this resistant cell model has acquired copy number alterations and mutations that impinge on MAPK and metabotropic glutamate receptor (GRM/mGluR) signaling networks, and that pharmacological inhibition of either improves or restores the growth-inhibitory actions of endocrine therapy.

Keywords: ESRRG (ERRgamma); Invasive lobular breast cancer (ILC); MAPK/ERK (MAPK1); Riluzole; Tamoxifen resistance; mGluR (GRM).


Figures

Figure 1
Figure 1
Expression of ESRRG and receptor target genes in Luminal A ILC. A, Tumor-derived ILC Signature (TIS) comprises top discriminant genes (50 up, 50 down) differentially expressed between Luminal A ILC and Luminal A IDC in the TCGA dataset from (Ciriello et al. 2015). Down-regulated genes in ILC vs. IDC include CDH1 and PTEN, which are mutated and deleted in ILC respectively. B, ESRRG mRNA expression is significantly higher in Luminal A ILC vs. Luminal A IDC in the combined METABRIC dataset in cBioPortal. Gene expression microarray data were compared by Mann-Whitney U test. C and D, mRNA expression of a four-gene ESRRG target signature is associated with poor outcome in Luminal A ILCs from TCGA (C) and METABRIC (D). mRNA levels are as measured by RNAseq (TCGA) or gene expression microarray (METABRIC), and high or low expression corresponds to above or below the median, respectively. Log-rank values calculated by cBioPortal.
Figure 2
Figure 2
Response to 4HT differs in SUM44 and LCCTam and suggests targetable pathways of TAM-resistance. A, SUM44 cells were treated with 500 nM 4HT for 24 hours and compared with controls while LCCTam maintained in 500 nM 4HT were compared with cells that were not treated with 4HT for 2 weeks. Affymetrix probe IDs for each comparison that had a fold change of ≥1.45 with a univariate p-value ≤0.05 were compared. B and C, Ingenuity Pathway Analysis (IPA) of Canonical Pathways for each cell line was completed and the top 20 affected pathways are shown; those discussed in the Results section are bolded. Red denotes pathways predicted to be downregulated in response to 4HT while green denotes upregulation.
Figure 3
Figure 3
MAPK1 amplification and FOXA1 gain in TAM-resistant ILC cells. A, Copy number plot for parental SUM44 cell line. Log2 copy number (CN) ratios (Y axis) are shown as colored points and the circular binary segmentation (CBS)-generated segments are shown as black lines. Gains and losses characteristic of ILC are shown. B, Copy number alterations in LCCTam vs. SUM44 cells. Genes within largest amplification and deletion as determined by CBS are shown as black squares. C, Table of selected chromosome locations, cytobands, and genes showing significant amplification, gain, or deletion in LCCTam cells as determined by ADM-2. *denotes chromosome 14 gain identified only by ADM-2, whereas others were identified by both CBS and ADM-2. D, Quantitative real-time polymerase chain reaction (RTPCR) validation of increased MAPK1 and FOXA1 mRNA expression in LCCTam cells. Data are presented as relative expression calculated by the 2−ΔΔCt method and are the mean of 5 biological replicates ± standard deviation, with each biological replicate comprised of 3 technical replicates. Data were analyzed by Mann-Whitney U test. E, Western blot analysis of phosphorylated and total ERK1/2 (MAPK1 gene = ERK2 protein), phosphorylated and total ER, and GAPDH as a loading control. LCCTam −4HT cells were cultured in the absence of 4HT for 48 hours. Data shown are from a single representative experiment that was performed independently twice.
Figure 4
Figure 4
NF1 and multiple GRMs/mGluRs are mutated in TAM-resistant ILC cells. A, Distribution of mutations in LCCTam cells by chromosome. Number of mutations per chromosome were analyzed in relation to chromosome length in megabases (Mb) by linear regression analysis. Dashed lines represent the 90%, 95%, and 99% confidence intervals. Red points denote chromosomes (numbers shown) with a greater than expected number of mutations, while green points denote those with fewer than expected. B, Table of selected chromosome locations, exons, alterations, and predicted functional consequences for genes mutated in LCCTam cells. C, Quantitative RTPCR validation of NF1 mRNA expression in LCCTam cells. Data are presented as relative expression calculated by the 2−ΔΔCt method and are the mean of 5 biological replicates ± standard deviation, with each biological replicate comprised of 3 technical replicates. Data were analyzed by Mann-Whitney U test. D, Lollipop plot showing location of GRM1 mutations in Luminal A ILC from the TCGA dataset, and the A229E mutation detected in LCCTam cells. Green denotes missense and black denotes nonsense mutations. Positions of the extracellular ligand (glutamate) binding domain (green rectangle) and 7-pass transmembrane domain (7Tm, blue rectangle) are shown. E, GRM1 protein expression in SUM44 and LCCTam cells by fluorescent immunocytochemistry. Negative staining control = no Ab (no primary antibody). Data shown are from a single representative experiment that was performed independently twice. F, Quantitative RTPCR validation of GRM2 mRNA expression in LCCTam cells. Data are presented as relative expression calculated by the 2−ΔΔCt method and are the mean of 3 biological replicates ± standard deviation, with each biological replicate comprised of 3 technical replicates. Data were analyzed by Mann-Whitney U test. G, Multiple GRMs/mGluRs are upregulated in LCCTam cells. Affymetrix gene expression microarray data are presented as mean fold change (increase) in LCCTam −4HT vs. SUM44 cells for three biological replicates compared by unpaired t test.
Figure 5
Figure 5
The MEK inhibitor U0126 or the glutamate release inhibitor Riluzole enhances or restores endocrine response in ILC cells. A, MEK inhibitor U0126 suppresses ERK phosphorylation. Cells were treated as indicated for 48 hours prior to Western blot analysis for phosphorylated ERK1/2 (MAPK1 gene = ERK2 protein), and β-actin as a loading control. Data shown are from a single representative experiment. B, Crystal violet cell proliferation assays conducted for 10 days (SUM44, LCCTam) or 6 days (MDA-MB-231) in the presence of the indicated concentrations of 4HT and/or U0126. Media were changed twice (SUM44, LCCTam) or once (MDA-MB-231) during the course of the experiment. Data are presented as mean relative cell number ± standard deviation for 5–6 technical replicates from an independent experiment performed at least twice. Data were analyzed by two-way ANOVA with post hoc Bonferroni correction. Relative index (RI) values = 1 are additive, > 1 are synergistic. C, Crystal violet proliferation assays conducted for 8 days in the presence of 1 μM Fulvestrant (ICI), 10 μM Riluzole (RIL), or the combination (Combo). Media were changed once during the course of the experiment. Data are presented as mean % survival for 5–6 technical replicates from an independent experiment performed three times. Data were analyzed by two-way ANOVA with post hoc Tukey’s test. Relative index (RI) values = 1 are additive, > 1 are synergistic. D, Expression of ER protein in SUM44 and LCCTam cells following 24 hours treatment with the indicated concentrations of Riluzole (RIL) alone or in combination with 1 μM Fulvestrant (ICI), with β-actin as a loading control. Data shown are from a single representative experiment performed independently three times.

Similar articles

Cited by

References

    1. Abecasis GR, Auton A, Brooks LD, DePristo MA, Durbin RM, Handsaker RE, Kang HM, Marth GT, McVean GA Consortium GP. An integrated map of genetic variation from 1,092 human genomes. Nature. 2012;491:56–65. - PMC - PubMed
    1. Abushahba W, Olabisi OO, Jeong BS, Boregowda RK, Wen Y, Liu F, Goydos JS, Lasfar A, Cohen-Solal KA. Non-canonical Smads phosphorylation induced by the glutamate release inhibitor, riluzole, through GSK3 activation in melanoma. PLoS One. 2012;7:e47312. - PMC - PubMed
    1. Aksamitiene E, Kiyatkin A, Kholodenko BN. Cross-talk between mitogenic Ras/MAPK and survival PI3K/Akt pathways: a fine balance. Biochem Soc Trans. 2012;40:139–146. - PubMed
    1. Azim HA, Davidson NE, Ruddy KJ. Challenges in Treating Premenopausal Women with Endocrine-Sensitive Breast Cancer. Am Soc Clin Oncol Educ Book. 2016;35:23–32. - PubMed
    1. Banda M, Speyer CL, Semma SN, Osuala KO, Kounalakis N, Torres Torres KE, Barnard NJ, Kim HJ, Sloane BF, Miller FR, et al. Metabotropic glutamate receptor-1 contributes to progression in triple negative breast cancer. PLoS One. 2014;9:e81126. - PMC - PubMed

Publication types

MeSH terms