. 2017 Oct 15;144(20):3719-3730.
doi: 10.1242/dev.156406. Epub 2017 Sep 21.

Suppression of ERK signalling abolishes primitive endoderm formation but does not promote pluripotency in rabbit embryo

Affiliations

Suppression of ERK signalling abolishes primitive endoderm formation but does not promote pluripotency in rabbit embryo

Anna Piliszek et al. Development. .

Abstract

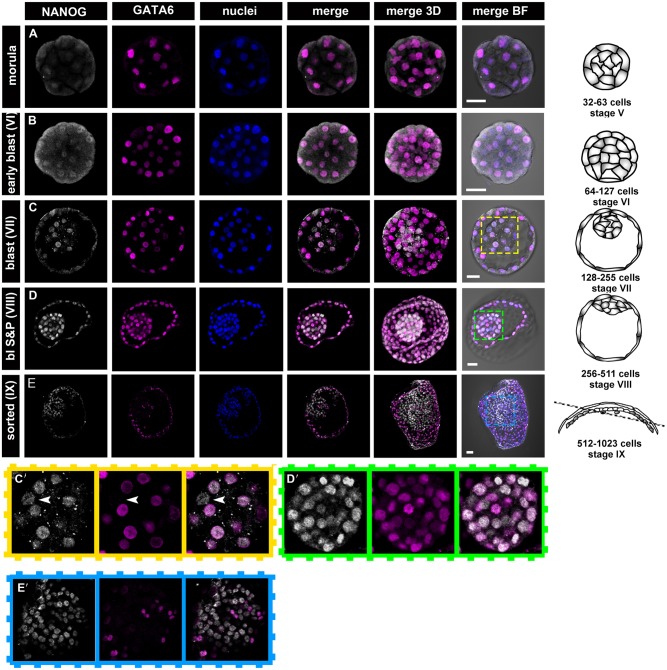
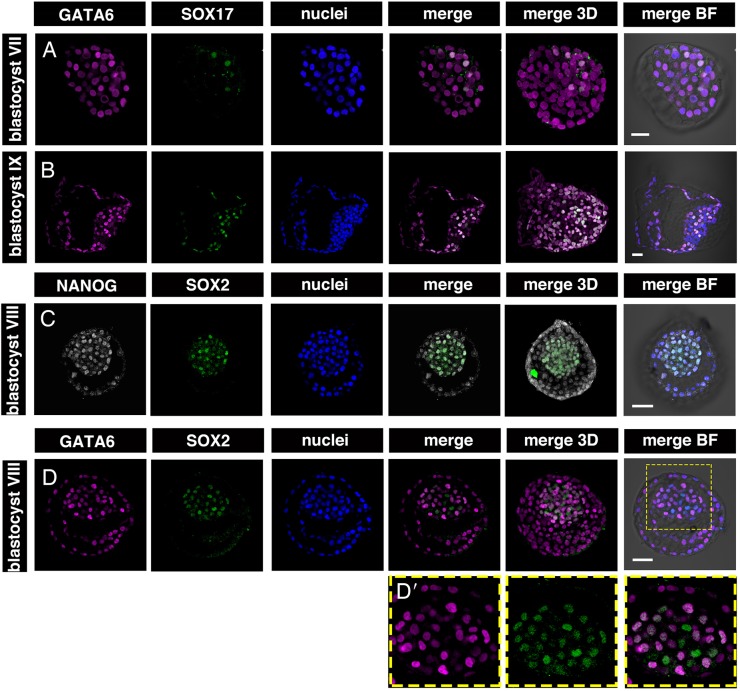
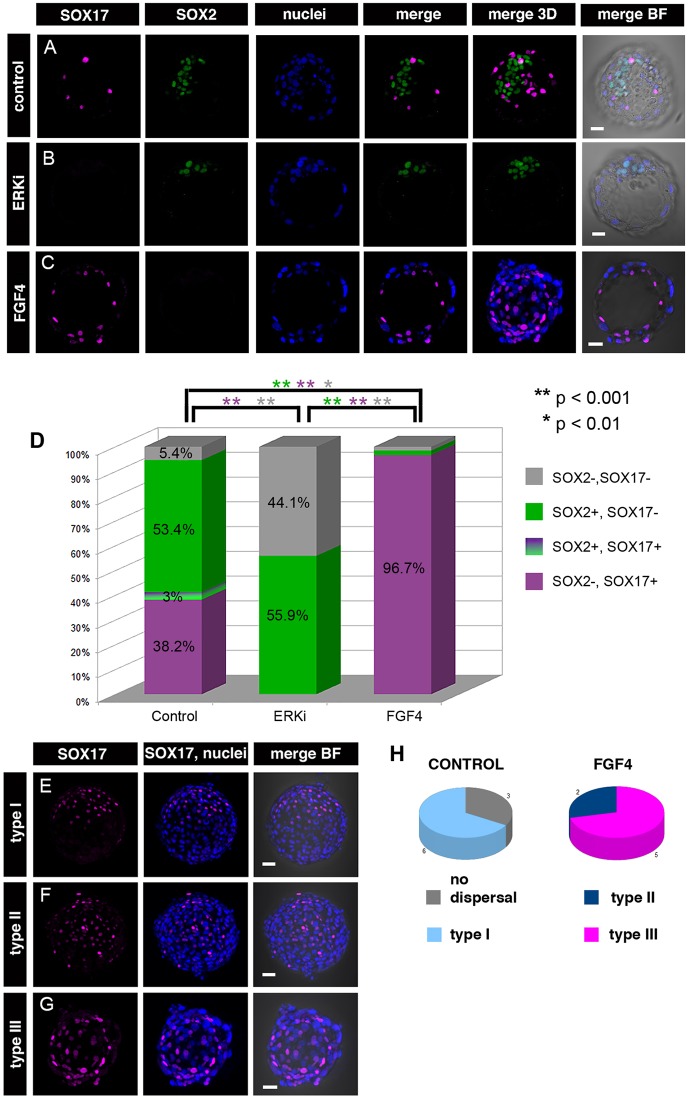
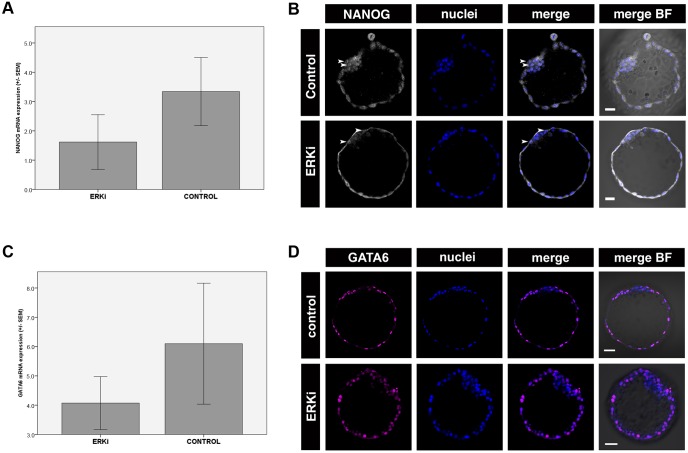
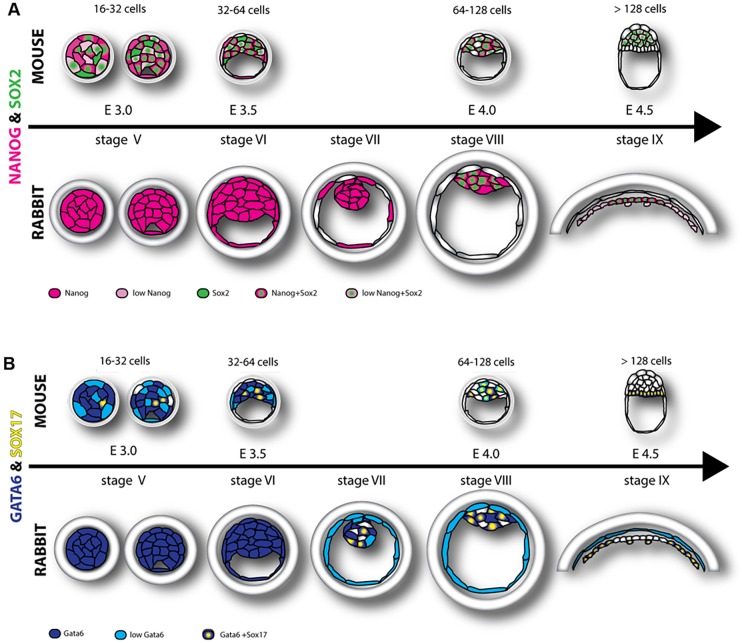
Formation of epiblast (EPI) - the founder line of all embryonic lineages - and extra-embryonic supportive tissues is one of the key events in mammalian development. The prevailing model of early mammalian development is based almost exclusively on the mouse. Here, we provide a comprehensive, stage-by-stage analysis of EPI and extra-embryonic primitive endoderm (PrE) formation during preimplantation development of the rabbit. Although we observed that rabbit embryos have several features in common with mouse embryos, including a stage-related initiation of lineage specification, our results demonstrate the existence of some key differences in lineage specification among mammals. Contrary to the current view, our data suggest that reciprocal repression of GATA6 and NANOG is not fundamental for the initial stages of PrE versus EPI specification in mammals. Furthermore, our results provide insight into the observed discrepancies relating to the role of FGF/ERK signalling in PrE versus EPI specification between mouse and other mammals.

Keywords: Blastocyst; Epiblast; FGF; Primitive endoderm; Rabbit.


Conflict of interest statement

Competing interestsThe authors declare no competing or financial interests.

Figures

Fig. 1.
Fig. 1.
Localisation of NANOG and GATA6 at the consecutive stages of development in rabbit embryos. (A,B) NANOG and GATA6 are detected in all cells of the late morula and stage VI blastocyst. (C-D′) At stages VII and VIII, NANOG is still present in all ICM cells, whereas GATA6 is absent from some ICM cells (arrowheads in C′ indicate GATA6-negative cells; both factors are still present in the TE). C′ and D′ show magnifications of the boxed areas (ICM) in C and D, respectively. (E,E′) In stage IX blastocysts, GATA6 and NANOG become mutually exclusive in the majority of ICM cells, and the PrE and EPI cells become sorted into separate compartments. E′ shows magnification of the boxed area (ICM) in E. Each row represents a single optical section of one embryo and is accompanied by a 3D composite reconstruction of a z-stack (3D merge) and a schematic representation of an embryo at the corresponding stage (drawings not to scale). Dotted line indicates the section plane. Confocal images in A-D and all schematic drawings represent side view of the embryo, confocal image in E represents top view of the embryo (note that the embryo is folded owing to its large size, which partially obscures the TE). BF, brightfield; white, NANOG; magenta, GATA6; blue, Hoechst (nuclear marker). Scale bars: 50 μm.
Fig. 2.
Fig. 2.
Localisation of SOX2 and SOX17 at consecutive stages of development in rabbit embryos. (A,B) SOX2 and SOX17 are absent in the morula and early blastocyst stage. (C,D) SOX17 is first detected in single ICM cells of stage VII blastocysts (C), and SOX2 in the ICM of the stage VIII blastocysts (D). D′ shows magnification of the boxed area (ICM) in D. Arrowheads indicate double-positive cell. (E) In the stage X blastocyst, the majority of SOX17-positive cells have become sorted into a ring surrounding SOX2-positive cells. Each row represents a single optical section of one embryo and is accompanied by a 3D composite reconstruction of a z-stack (3D merge) and a schematic of an embryo of the corresponding stage (drawings not to scale). Dotted line indicates the section plane. Confocal images in A-C and all schematics represent side view of the embryo, confocal images in D,E represent top view of the embryo. BF, brightfield; green, SOX2; magenta, SOX17; blue, Hoechst (nuclear marker). Scale bars: 50 μm.
Fig. 3.
Fig. 3.
Colocalisation of EPI and PrE markers in rabbit blastocysts. (A) The PrE marker SOX17 is first detected in the ICM of the stage VII blastocyst, localising only to GATA6-positive cells. (B) As the blastocyst expands, the number of SOX17+/GATA6+ PrE cells increases, becoming spatially segregated from EPI in the stage IX blastocysts. Some of the SOX17+/GATA+ cells start migrating along the inner surface of the mural TE (weakly GATA6-positive TE cells are SOX17 negative). (C,D) The EPI marker SOX2 is first detected in the stage VIII blastocysts, colocalising with NANOG (C) and with the PrE-associated marker GATA6 (D) in some ICM cells. D′ shows magnification of the boxed area (ICM) in D. Each row represents a single optical section of one embryo. BF, brightfield; magenta, GATA6; white, NANOG; green, SOX17 (A,B) and SOX2 (C,D); blue, Hoechst (nuclear marker). Scale bars: 50 μm.
Fig. 4.
Fig. 4.
Effects of FGF/ERK inhibition and activation in rabbit preimplantation development. Immunolocalisation of PrE and EPI markers in rabbit blastocyst after in vitro culture. (A) Control embryos form ICM, correctly specifying and sorting SOX17-positive PrE cells and SOX2-positive EPI cells. (B) Embryos cultured in the presence of MEK/ERK inhibitor (ERKi) from compacted morula onward are devoid of SOX17-positive cells, with ICMs containing SOX2-positive and some double-negative (SOX2−, SOX17−) cells. (C) No SOX2-positive cells or inner cell mass are found in embryos cultured in the presence of FGF4, whereas SOX17-positive cells were spread underneath the TE. Each row of images represents a single optical section of one embryo. BF, brightfield; magenta, SOX17; green, SOX2; blue, Hoechst (nuclear marker). (D) Quantification of ICM contribution of SOX17+ and SOX2+ cells in control, ERKi-treated and FGF4-treated embryos. Percentage contribution of each cell type is indicated. Statistically significant differences between groups are marked by colour-coded asterisks, P values are as indicated (Z-test). (E-G) Distribution of SOX17-positive cells in FGF4-treated embryos. (E) Type I: SOX17-positive cells assembled on one pole of the embryo forming a continuous layer. (F) Type II: SOX17-positive cells dispersed underneath the TE and covering not more than half of the inner surface of the blastocoel. (G) Type III: SOX17-positive cells covering the whole cavity. (H) Pie charts representing dispersal of SOX17+ cells in control and FGF4-treated embryos. Scale bars: 50 μm.
Fig. 5.
Fig. 5.
Effects of FGF/ERK inhibition and activation on GATA6 and NANOG expression and localisation in rabbit preimplantation development. (A,C) Expression levels of NANOG (A) and GATA6 (C) mRNA in control and ERKi-treated rabbit embryos after in vitro culture. Error bars represent s.e.m. (B,D) NANOG (B) and GATA6 (D) distribution in control and ERKi-treated rabbit embryos. Each row represents a single optical section of one embryo. BF, brightfield; white, NANOG; blue, Hoechst (nuclear marker). Scale bars: 50 μm.
Fig. 6.
Fig. 6.
Multi-step model of EPI/PrE lineage formation in mouse and rabbit embryos. (A) In mouse embryos, the EPI markers NANOG and SOX2 are initially expressed in all blastomeres (16-32 cells), becoming restricted to EPI precursors distributed in a mosaic pattern within the ICM at around the 64-cell stage and sorting into EPI compartment at around the 120-cell stage, when NANOG is downregulated. In rabbit embryos, compact morulae (stage V) and blastocysts up to stage VII express NANOG, but not SOX2, in all cells. At stage VIII, SOX2 expression initiates in the majority of the ICM cells, and nearly all ICM cells still express NANOG. At stage IX, all EPI precursors express SOX2 and NANOG, concomitant with EPI and PrE cell sorting. (B) In mouse embryos, the PrE marker GATA6 is initially expressed in all of the cells. SOX17 becomes expressed in a few GATA6-positive cells in the ICM. At around the 64-cell stage, GATA6+/SOX17+ cells are distributed in a mosaic fashion in the ICM, later on sorting into the PrE compartment adjacent to the blastocoel cavity. In rabbit embryos, GATA6 is also initially expressed in all of the cells in morula, up to stage VI blastocyst. At stage VII, SOX17 expression initiates in some of the GATA6-positive ICM cells. At stage VIII, the proportion of GATA6/SOX17 double-positive cells as well as the proportion of GATA6-negative cells in the ICM increases. At stage IX, GATA6 and SOX17 are fully colocalised in the PrE and absent from EPI, while the ICM flattens and two compartments become sorted, with PrE encircling the EPI.

Similar articles

Cited by

References

    1. Acampora D., Omodei D., Petrosino G., Garofalo A., Savarese M., Nigro V., Di Giovannantonio L. G., Mercadante V. and Simeone A. (2016). Loss of the Otx2-binding site in the Nanog promoter affects the integrity of embryonic stem cell subtypes and specification of inner cell mass-derived epiblast. Cell Rep. 15, 2651-2664. 10.1016/j.celrep.2016.05.041 - DOI - PubMed
    1. Aksoy I., Jauch R., Chen J., Dyla M., Divakar U., Bogu G. K., Teo R., Leng Ng C. K., Herath W., Lili S. et al. (2013). Oct4 switches partnering from Sox2 to Sox17 to reinterpret the enhancer code and specify endoderm. EMBO J. 32, 938-953. 10.1038/emboj.2013.31 - DOI - PMC - PubMed
    1. Artus J., Piliszek A. and Hadjantonakis A.-K. (2011). The primitive endoderm lineage of the mouse blastocyst: sequential transcription factor activation and regulation of differentiation by Sox17. Dev. Biol. 350, 393-404. 10.1016/j.ydbio.2010.12.007 - DOI - PMC - PubMed
    1. Avilion A. A., Nicolis S. K., Pevny L. H., Perez L., Vivian N. and Lovell-Badge R. (2003). Multipotent cell lineages in early mouse development depend on SOX2 function. Genes Dev. 17, 126-140. 10.1101/gad.224503 - DOI - PMC - PubMed
    1. Bessonnard S., De Mot L., Gonze D., Barriol M., Dennis C., Goldbeter A., Dupont G. and Chazaud C. (2014). Gata6, Nanog and Erk signaling control cell fate in the inner cell mass through a tristable regulatory network. Development 141, 3637-3648. 10.1242/dev.109678 - DOI - PubMed

Publication types