

Unraveling transcriptome dynamics in human spermatogenesis
- PMID: 28935708
- PMCID: PMC5675447
- DOI: 10.1242/dev.152413
Unraveling transcriptome dynamics in human spermatogenesis
Abstract
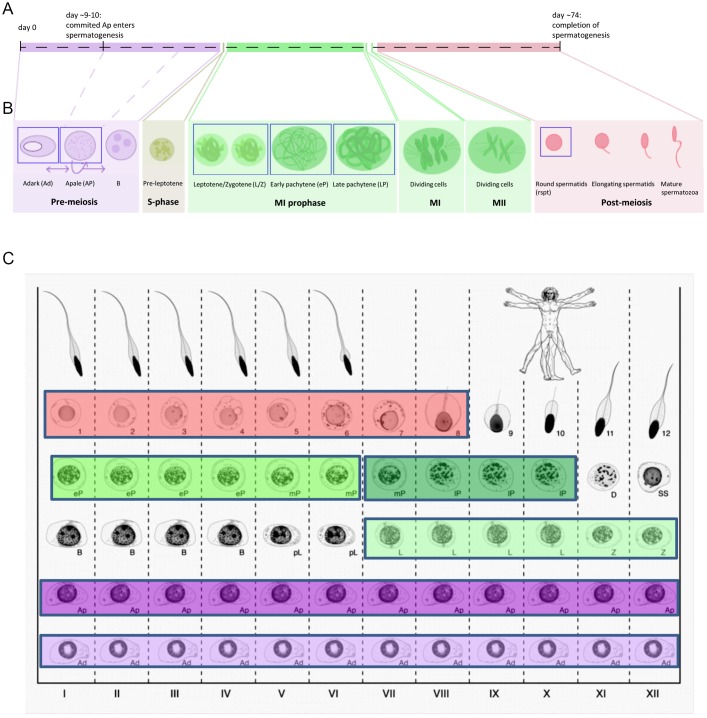
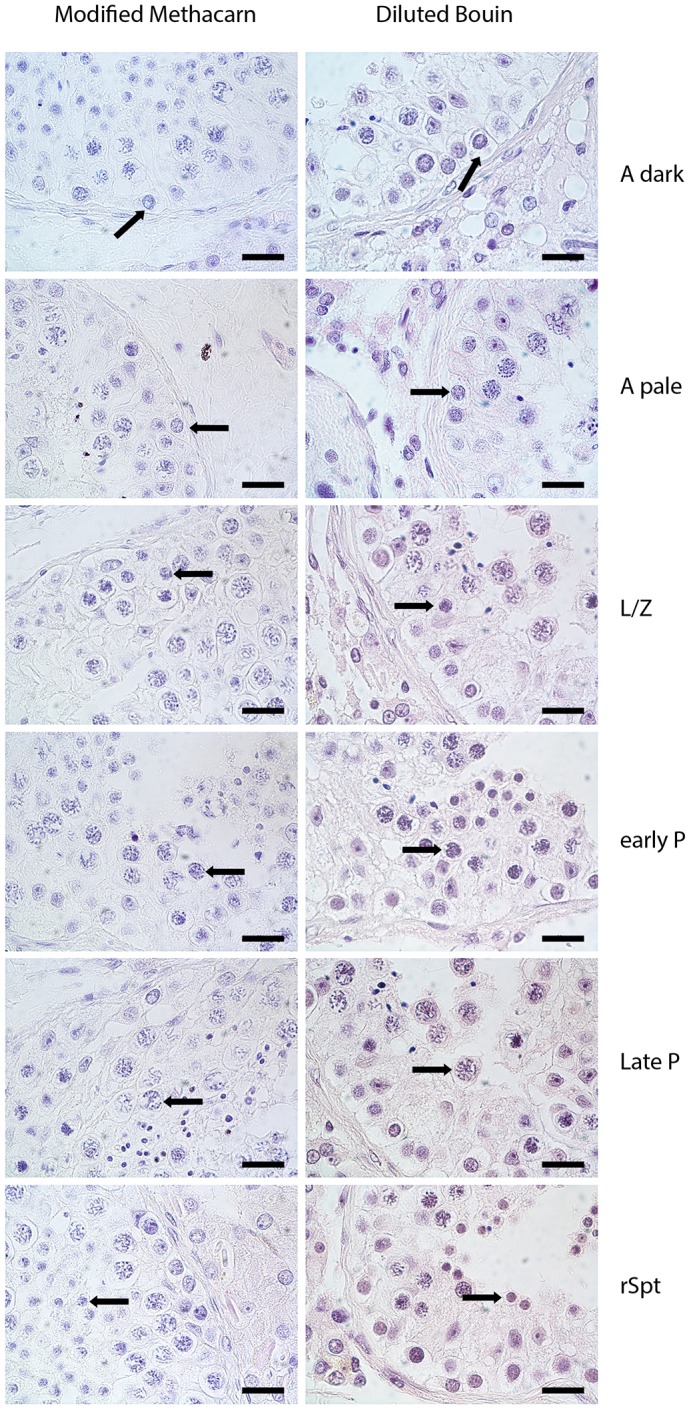
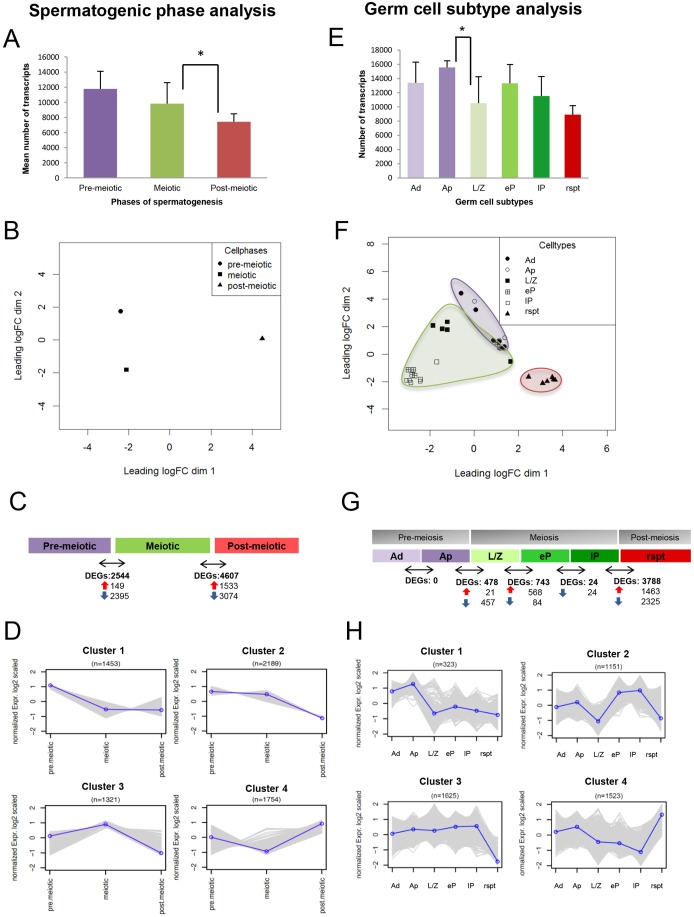
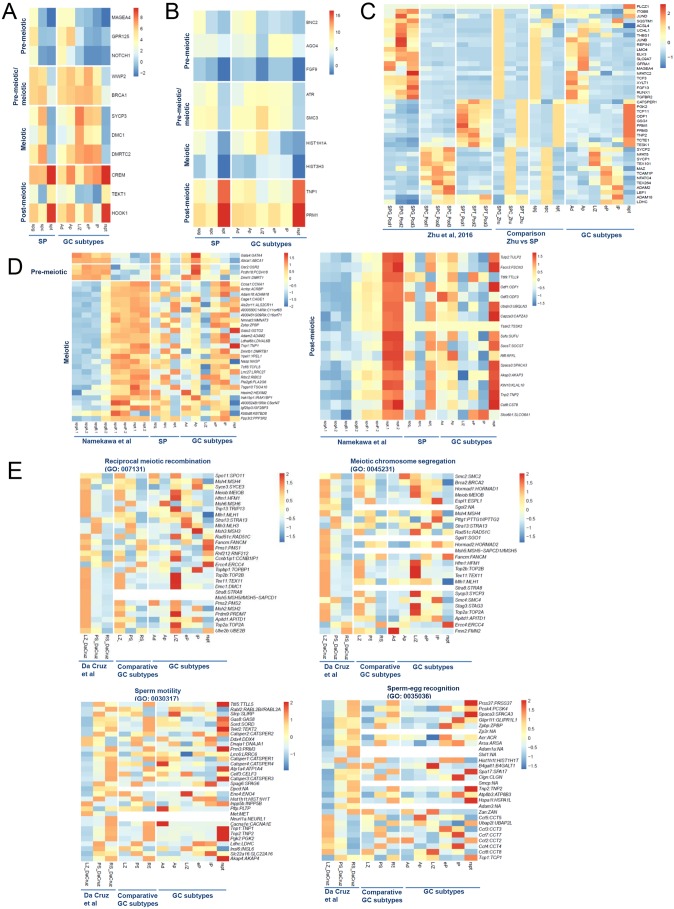
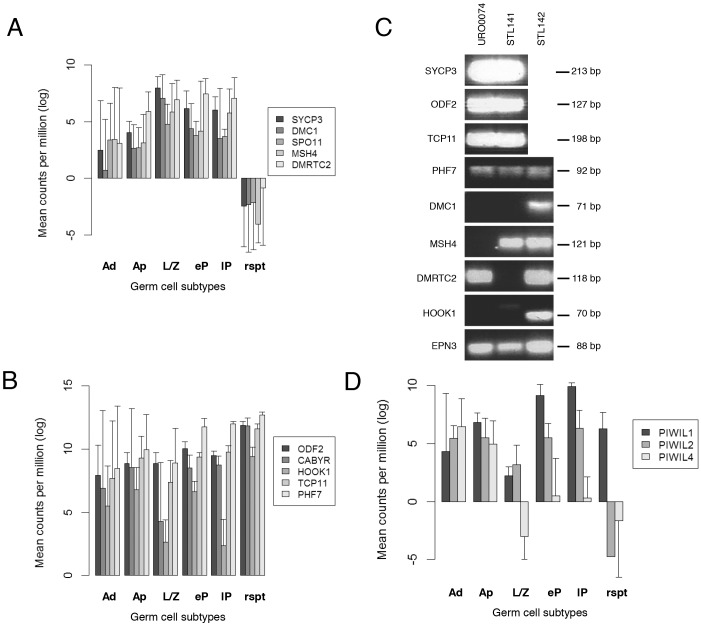
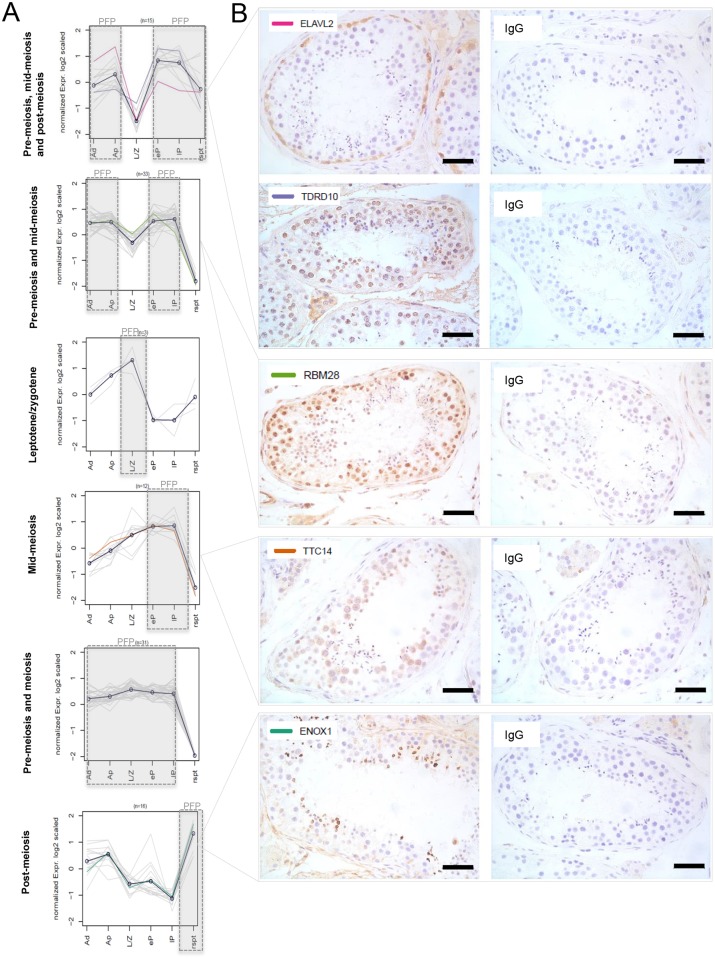
Spermatogenesis is a dynamic developmental process that includes stem cell proliferation and differentiation, meiotic cell divisions and extreme chromatin condensation. Although studied in mice, the molecular control of human spermatogenesis is largely unknown. Here, we developed a protocol that enables next-generation sequencing of RNA obtained from pools of 500 individually laser-capture microdissected cells of specific germ cell subtypes from fixed human testis samples. Transcriptomic analyses of these successive germ cell subtypes reveals dynamic transcription of over 4000 genes during human spermatogenesis. At the same time, many of the genes encoding for well-established meiotic and post-meiotic proteins are already present in the pre-meiotic phase. Furthermore, we found significant cell type-specific expression of post-transcriptional regulators, including expression of 110 RNA-binding proteins and 137 long non-coding RNAs, most of them previously not linked to spermatogenesis. Together, these data suggest that the transcriptome of precursor cells already contains the genes necessary for cellular differentiation and that timely translation controlled by post-transcriptional regulators is crucial for normal development. These established transcriptomes provide a reference catalog for further detailed studies on human spermatogenesis and spermatogenic failure.
Keywords: Gamete development; Human; RNA-binding proteins; RNA-sequencing; Spermatogenesis.
© 2017. Published by The Company of Biologists Ltd.
Conflict of interest statement
Competing interestsThe authors declare no competing or financial interests.
Figures
Similar articles
-
Transcriptome analysis of highly purified mouse spermatogenic cell populations: gene expression signatures switch from meiotic-to postmeiotic-related processes at pachytene stage.BMC Genomics. 2016 Apr 19;17:294. doi: 10.1186/s12864-016-2618-1. BMC Genomics. 2016. PMID: 27094866 Free PMC article.
-
Developmental expression of Musashi-1 and Musashi-2 RNA-binding proteins during spermatogenesis: analysis of the deleterious effects of dysregulated expression.Biol Reprod. 2014 May 1;90(5):92. doi: 10.1095/biolreprod.113.115261. Print 2014 May. Biol Reprod. 2014. PMID: 24671879
-
Altered gene expression signature of early stages of the germ line supports the pre-meiotic origin of human spermatogenic failure.Andrology. 2014 Jul;2(4):596-606. doi: 10.1111/j.2047-2927.2014.00217.x. Epub 2014 May 7. Andrology. 2014. PMID: 24803180
-
Long noncoding RNAs in spermatogenesis: insights from recent high-throughput transcriptome studies.Reproduction. 2014 Apr 8;147(5):R131-41. doi: 10.1530/REP-13-0594. Print 2014 May. Reproduction. 2014. PMID: 24713396 Review.
-
MicroRNAs and spermatogenesis.Fertil Steril. 2014 Jun;101(6):1552-62. doi: 10.1016/j.fertnstert.2014.04.025. Fertil Steril. 2014. PMID: 24882619 Review.
Cited by
-
Indolaminergic System in Adult Rat Testes: Evidence for a Local Serotonin System.Front Neuroanat. 2021 Feb 19;14:570058. doi: 10.3389/fnana.2020.570058. eCollection 2020. Front Neuroanat. 2021. PMID: 33679336 Free PMC article.
-
Transcriptome profiling reveals signaling conditions dictating human spermatogonia fate in vitro.Proc Natl Acad Sci U S A. 2020 Jul 28;117(30):17832-17841. doi: 10.1073/pnas.2000362117. Epub 2020 Jul 13. Proc Natl Acad Sci U S A. 2020. PMID: 32661178 Free PMC article.
-
Distinct prophase arrest mechanisms in human male meiosis.Development. 2018 Apr 16;145(16):dev160614. doi: 10.1242/dev.160614. Development. 2018. PMID: 29540502 Free PMC article.
-
From the Argonauts Mythological Sailors to the Argonautes RNA-Silencing Navigators: Their Emerging Roles in Human-Cell Pathologies.Int J Mol Sci. 2020 Jun 3;21(11):4007. doi: 10.3390/ijms21114007. Int J Mol Sci. 2020. PMID: 32503341 Free PMC article. Review.
-
Dissecting the spermatogonial stem cell niche using spatial transcriptomics.Cell Rep. 2023 Jul 25;42(7):112737. doi: 10.1016/j.celrep.2023.112737. Epub 2023 Jul 1. Cell Rep. 2023. PMID: 37393620 Free PMC article.
References
-
- Amireault P., Hatia S., Bayard E., Bernex F., Collet C., Callebert J., Launay J.-M., Hermine O., Schneider E., Mallet J. et al. (2011). Ineffective erythropoiesis with reduced red blood cell survival in serotonin-deficient mice. Proc. Natl. Acad. Sci. USA 108, 13141-13146. 10.1073/pnas.1103964108 - DOI - PMC - PubMed
-
- Barrios F., Filipponi D., Pellegrini M., Paronetto M. P., Di Siena S., Geremia R., Rossi P., De Felici M., Jannini E. A. and Dolci S. (2010). Opposing effects of retinoic acid and FGF9 on Nanos2 expression and meiotic entry of mouse germ cells. J. Cell Sci. 123, 871-880. 10.1242/jcs.057968 - DOI - PubMed
Publication types
MeSH terms
Substances
LinkOut - more resources
Full Text Sources
Other Literature Sources
