. 2017 Nov 1;144(21):4002-4014.
doi: 10.1242/dev.147934. Epub 2017 Sep 21.

Neural-specific deletion of the focal adhesion adaptor protein paxillin slows migration speed and delays cortical layer formation

Affiliations

Neural-specific deletion of the focal adhesion adaptor protein paxillin slows migration speed and delays cortical layer formation

Mamunur Rashid et al. Development. .

Abstract

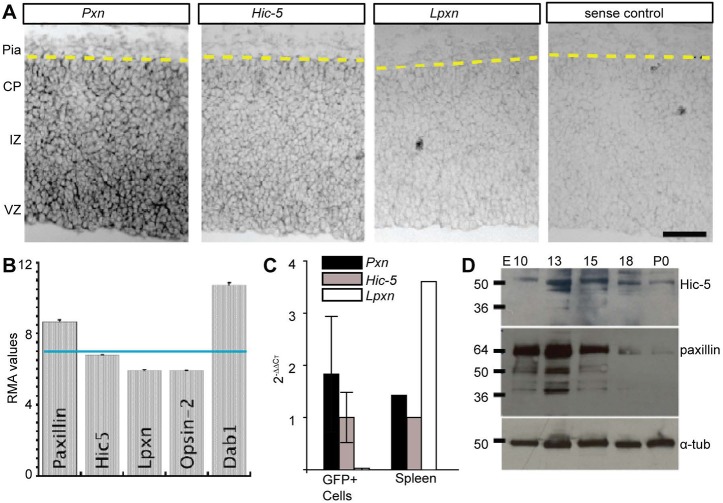
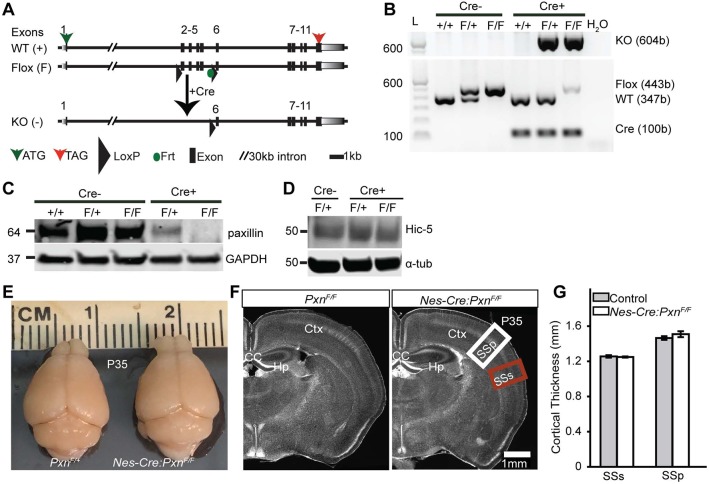
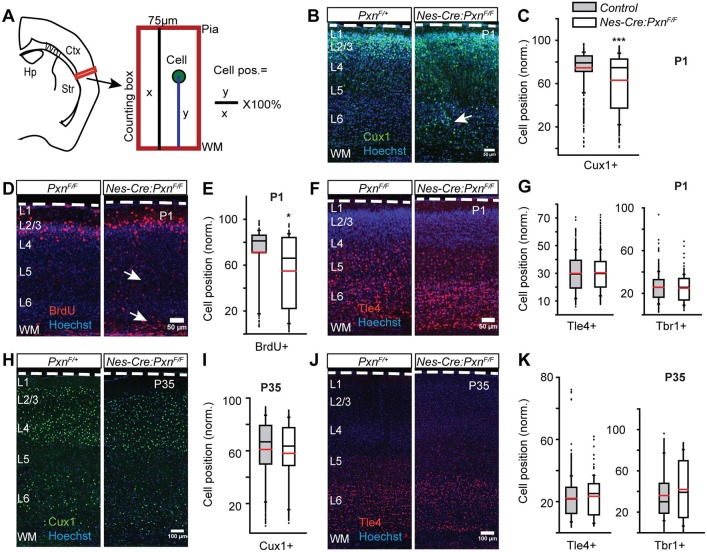
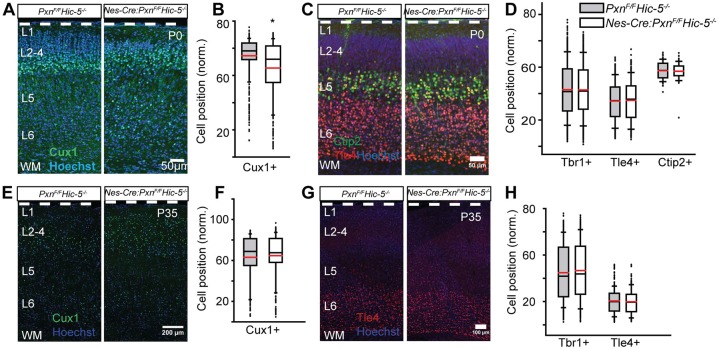
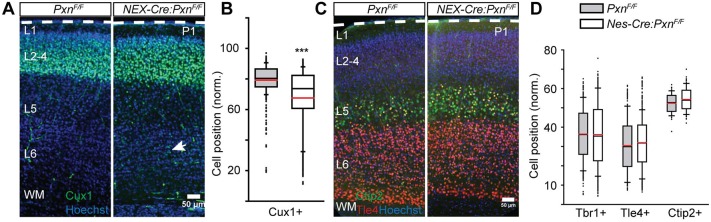
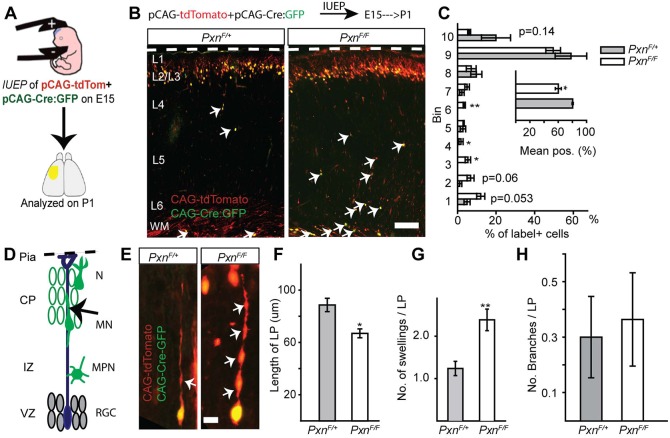
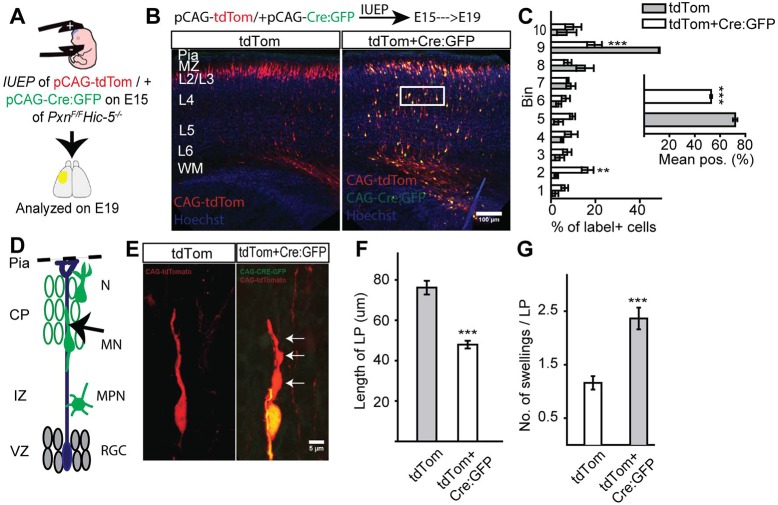
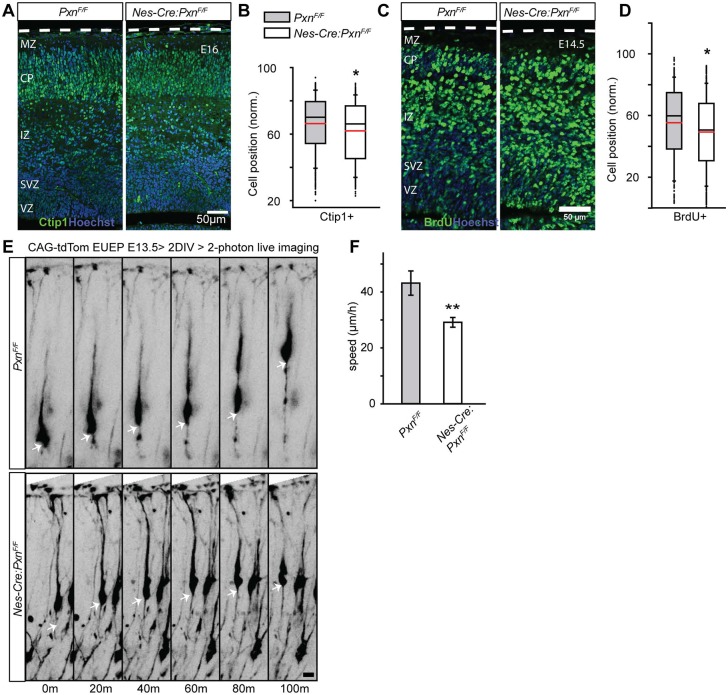
Paxillin and Hic-5 are homologous focal adhesion adaptor proteins that coordinate cytoskeletal rearrangements in response to integrin signaling, but their role(s) in cortical development are unknown. Here, we find that Hic-5-deficient mice are postnatal viable with normal cortical layering. Mice with a neural-specific deletion of paxillin are also postnatal viable, but show evidence of a cortical neuron migration delay that is evident pre- and perinatally, but is not detected at postnatal day 35 (P35). This phenotype is not modified by Hic-5 deficiency (double knockout). Specific deletion of paxillin in postmitotic neurons using Nex-Cre-mediated recombination as well as in utero electroporation of a Cre-expression construct identified a cell-autonomous requirement for paxillin in migrating neurons. Paxillin-deficient neurons have shorter leading processes that exhibited multiple swellings in comparison with control. Multiphoton imaging revealed that paxillin-deficient neurons migrate ∼30% slower than control neurons. This phenotype is similar to that produced by deletion of focal adhesion kinase (FAK), a signaling partner of paxillin, and suggests that paxillin and FAK function cell-autonomously to control migrating neuron morphology and speed during cortical development.

Keywords: Cortical development; Developmental delay; Glial guided migration; Leading process.


Conflict of interest statement

Competing interestsThe authors declare no competing or financial interests.

Figures

Fig. 1.
Fig. 1.
Paxillin and Hic-5 are expressed in the developing cortex. (A) In situ hybridization of E15.5 neocortex using paxillin (Pxn), Hic-5 and leupaxin (Lpxn) probes. Pxn and Hic-5 were detected prominently in the VZ, with lower in situ signal in the IZ and CP. (B) Microarray analysis of immature excitatory neurons isolated by FACS from Tg(Eomes-eGFP)Gsat cortex at E14.5 (Cameron et al., 2012). Pxn and Hic-5 RMA (robust multichip average) expression levels are above the expression level of Lpxn and eye-specific opsin 2 (not expressed). (C) RT-qPCR analysis of immature excitatory neurons (GFP+) isolated by FACS from Tg(Eomes-eGFP)Gsat cortex at E14.5 (n=3 embryos). Values were first normalized (to G6PDH) and then presented relative to Hic-5 2–ΔΔCT. Spleen tissue (n=1) was used as a positive control. (D) Western blot analyses of paxillin and Hic-5 protein in the developing cortex (E10-P0). Paxillin and Hic-5 are expressed highly during corticogenesis (E13-E15) but decrease perinatally (P0). α-tubulin was used as a loading control. VZ, ventricular zone; IZ, intermediate zone; CP, cortical plate. Scale bar: 50 µm.
Fig. 2.
Fig. 2.
Generation of the Pxn flox allele and neural precursor-specific deletion of paxillin by Nes-Cre. (A) Schematic of the Pxn wild-type and Pxn flox allele. After Cre-mediated recombination, exons 2-5 are removed creating a frameshift and multiple stop codons in exon 6. (B) Genotyping of DNA isolated from brain. Expression of the KO allele (604 bp) in the presence of Cre confirms the recombination event. The faint flox band in the presence of Cre is presumably due to unrecombined DNA from non-neural tissues, including blood vessels and meninges. (C) Western blot analysis confirming the deletion of paxillin from the mutant cortex. (D) Hic-5 protein levels were unchanged in Pxn-deficient tissue. (E) Representative images of control (PxnF/+) and mutant (Nes-Cre:PxnF/F) brains at P35. (F) Coronal sections of cortex stained with Hoechst 33342 nuclear dye showing the major structures of the brain. (G) There was no difference in the cortical thicknesses of supplemental somatosensory (SSs, red box in F) or primary somatosensory cortex (SSp, white box in F) between the groups (n=4 per group). Error bars represent s.e.m. Data were analyzed using unpaired Student's t-test. Scale bar: 1 mm.
Fig. 3.
Fig. 3.
Neural precursor-specific deletion of paxillin delays upper layer neuronal positioning. (A) Schematic of neuronal positioning analyses within a defined area in lateral neocortex (box). Neuronal positions (y) were measured from the underlying white matter (WM), normalized to the total thickness of the cortical wall (x), and expressed as a percentage. (B-G) Neuronal position at P1. (B) Representative images of P1 littermate controls (PxnF/+) and mutants (Nes-Cre:PxnF/F) immunostained for Cux1 (green). More Cux1+ neurons were found in ectopic deep positions (arrow) in the mutant cortex compared with littermate controls. (C) Box-and-whisker plot showing a broad distribution of Cux1+ neurons in the mutant cortices. The mean position of Cux1+ neurons was significantly deeper in the mutant cortex [n=7 for control (4 Pxn F/+ and 3 Nes-Cre;PxnF/+) and n=5 for Nes-Cre;PxnF/F]. (D) Representative images of BrdU+ (injected at E15.5) neurons (red) at P1 showing ectopic BrdU+ cells in the deep cortex (arrows). (E) Box-and-whisker plot showing the distribution of BrdU+ neurons in the mutant cortices. The mean position of BrdU+ neurons was significantly deeper in the mutant cortex [n=3 for PxnF/F (control) and n=4 for Nes-Cre;PxnF/F (mutant)]. (F) Representative images of Tle4+ neurons (red) at P1. (G) Box-and-whisker plot distribution of Tle4+ neurons and Tbr1+ neurons. There was no difference in the mean position of Tle4+ [n=3 for PxnF/F (control) and n=4 for Nes-Cre;PxnF/F (mutant)] neurons and no difference between Tbr1+ [n=4 Pxn F/+, n=3 Nes-Cre;PxnF/+ (controls) and n=5 for Nes-Cre;PxnF/F (mutant)] neurons. (H-K) Neuronal position analysis in P35 cortex. (H) Representative images of P35 littermate control (PxnF/+) and mutant (Nes-Cre:PxnF/F) neurons immunostained for Cux1 (green). (I) Distribution of Cux1+ neurons. No difference in the mean position of Cux1+ neurons was detected between genotypes [n=7 for control (n=4 PxnF/+ and n=3 Nes-Cre;PxnF/+) and n=4 for Nes-Cre;PxnF/F(mutant)]. (J) Representative image of Tle4+ (red) neurons at P35. (K) Distribution of Tle4+ and Tbr1+ neurons. No difference in the mean position of either Tle4+ [n=9 in control (n=5 PxnF/+ and n=4 Nes-Cre;PxnF/+), n=5 in Nes-Cre;PxnF/F (mutant)] or Tbr1+ [n=6 in control (n=3 PxnF/+ and n=3 Nes-Cre;PxnF/+), n=4 in Nes-Cre;PxnF/F (mutant)] neurons was detected between genotypes. Dashed white lines outline the pial surface. Data were analyzed using unpaired Student's t-test. *P<0.05, ***P<0.001. Scale bars: 50 µm in B,D,F; 100 µm in H,J.
Fig. 4.
Fig. 4.
Combined Hic-5 deficiency with paxillin deficiency (dKO) produces an upper layer neuronal positioning defect similar to that observed with paxillin deficiency alone. (A-D) Neuronal position analysis of P0 cortex. (A) Representative images of P0 littermate control and dKO immunostained for Cux1 (green). More Cux1+ neurons were found in ectopic deep positions in the dKO cortex compared with littermate controls. (B) Box-and-whisker plot distribution of Cux1+ neurons showing a broad distribution of Cux1+ neurons in the dKO cortex. Mean position of Cux1+ neurons is significantly deeper in the dKO cortex (n=5 per group). (C) Representative images of Tle4+ (red) and Ctip2 (green) neurons at P0. (D) Distribution of Tbr1+ (n=5), Tle4+ (n=4) and Ctip2+ (n=3) neurons. No difference in the mean positions of the markers was found between genotypes. (E-H) Neuronal position analysis of P35 cortex. (E) Representative images of P35 littermate control and dKO immunostained for Cux1 (green). (F) Distribution of Cux1+ neurons. There was no difference in the mean position of Cux1+ neurons between genotypes (n=6). (G) Representative image of Tle4+ (red) neurons at P35. (H) Distribution of Tbr1+ (n=6) and Tle4+ (n=4) neurons. There was no difference in the mean position of either Tbr1+ or Tle4+ neurons between genotypes. Data were analyzed using unpaired Student's t-test. *P<0.05. Scale bars: 50 µm in A,C; 200 μm in E; 100 μm in G.
Fig. 5.
Fig. 5.
Paxillin deficiency in post-mitotic neurons disrupts neuronal positioning. (A) Representative sections of littermate control (PxnF/F) and mutant (NEX-Cre:PxnF/F), with a conditional deletion of paxillin in post-mitotic immature neurons, were immunostained for Cux1 (green). More Cux1+ neurons were found in ectopic deep positions in the mutant cortex (arrow). (B) Box-and-whisker plot distribution of positions of Cux1+ neurons. The mutant showed a broader distribution compared with littermate controls. The mean position of Cux1+ neurons was significantly deeper in the mutant cortex (n=3 in PxnF/F and n=4 in NEX-Cre:PxnF/F). (C) Representative images of Tle4+ (red) and Ctip2+ (green) neurons. (D) Distribution of Tbr1+ (n=3 in PxnF/F and n=4 in NEX-Cre:PxnF/F), Tle4+ (n=3 in PxnF/F and n=4 in NEX-Cre:PxnF/F) and Ctip2+ (n=3 in PxnF/F and n=4 in NEX-Cre:PxnF/F) neurons. There was no difference in the mean positions of the Tbr1+, Tle4+ and Ctip2+ neurons between the genotypes. ***P<0.001. Scale bars: 50 µm.
Fig. 6.
Fig. 6.
Cell-autonomous deletion of paxillin alters neuronal positioning and morphology. (A) In utero electroporation of pCAG-Cre:GFP+pCAG-tdTomato into PxnF/+ (control) or PxnF/F (paxillin-deficient) was performed at E15. (B) Representative image of control and paxillin-deficient neurons analyzed at P1. (C) Analysis of cell position across the cortical wall by bins (bin 1 includes WM and bin 10 includes L1). The mean cell position of the paxillin-deficient group is 20% deeper than control. (D) Schematic of radial migration and a bipolar migrating neuron (arrow) analyzed in the cortical plate (CP). (E) A control (PxnF/+) migrating neuron with an extended leading process (left panel). Cre-mediated deletion of paxillin shortened and increased the number of swellings (arrows) in the leading process (right panel). (F) Quantification of leading process lengths (n=15 cells per group). (G) Quantification of leading process swellings (n=21 cells for PxnF/+, n=26 cells for PxnF/F). (H) The number of leading process branches was indistinguishable between the groups (n=20 cells for PxnF/+, n=22 cells for PxnF/F). CP, cortical plate; IZ, intermediate zone; WM, white matter; VZ, ventricular zone; RGC, radial glial cells; MPN, multipolar neurons; MN, migrating neurons; N, differentiated neurons. *P<0.05, **P<0.01. Scale bars: 100 µm in B; 10 µm in E.
Fig. 7.
Fig. 7.
Cell-autonomous deletion of paxillin in Hic-5−/− cortex alters neuronal positioning and morphology. (A) In utero electroporation of pCAG-tdTomato±pCAG-Cre:GFP into Hic-5−/−PxnF/F embryos was performed at E15. (B) Representative images of control (CAG-tdTom group) and dKO (CAG-tdTom+CAG-Cre:GFP group) neurons analyzed at E19. (C) Analysis of cell position across the cortical wall by bins (bin 1 includes WM and bin 10 includes L1). The mean cell position of the dKO group is 19% deeper than control. (D) Schematic of radial migration and a bipolar migrating neuron (arrow) analyzed in the cortical plate (CP). (E) A control (Hic-5−/−PxnF/F) migrating neuron with an extended leading process (left panel). Cre-mediated deletion of paxillin shortened and increased the number of swellings (arrows) in the leading process of a dKO neuron (right panel). (F) Quantification of leading process lengths (n=20 per group). (G) Quantification of leading process swellings (n=25 cells for control; n=22 cells for mutant). CP, cortical plate; IZ, intermediate zone; WM, white matter; VZ, ventricular zone; RGC, radial glial cells; MPN, multipolar neurons; MN, migrating neurons; N, differentiated neurons. **P<0.01, ***P<0.001. Scale bars: 100 µm in B; 5 µm in E.
Fig. 8.
Fig. 8.
Paxillin-deficient mutant neurons migrate slowly. (A) Representative images of littermate control and Nes-Cre:PxnF/F paxillin-deficient cortical sections immunostained for Ctip1 (green) at E16. (B) Box-and-whisker plot distribution of Ctip1+ neurons. The mean position of Ctip1+ neurons was 4.5% deeper in the paxillin mutant (n=3/group). (C) Representative images of BrdU+ (injected at E12.5) neurons (red) at E14.5 showing ectopic BrdU positioning in the deep cortex. (D) Box-and-whisker plot showing a broad distribution of BrdU+ neurons in the mutant cortices. The mean position of BrdU+ neurons was significantly deeper in the mutant cortex (n=4 in PxnF/F, n=5 in Nes-Cre:PxnF/F). (E) Multiphoton images GFP-labeled neurons in whole hemisphere explants from PxnF/F (control) and Nes-Cre:PxnF/F (mutant) embryos. Arrows show the position of a single neuronal soma over time. (F) Quantification of speed of migrating neurons (n=12 cells per group from three mutant and three control explants). *P<0.05, **P<0.01. Scale bars: 50 µm in A,C; 10 µm in E.

Similar articles

Cited by

References

    1. Anton E. S., Kreidberg J. A. and Rakic P. (1999). Distinct functions of alpha3 and alpha(v) integrin receptors in neuronal migration and laminar organization of the cerebral cortex. Neuron 22, 277-289. 10.1016/S0896-6273(00)81089-2 - DOI - PubMed
    1. Bahi-Buisson N., Poirier K., Fourniol F., Saillour Y., Valence S., Lebrun N., Hully M., Bianco C. F., Boddaert N., Elie C. et al. (2014). The wide spectrum of tubulinopathies: what are the key features for the diagnosis? Brain 137, 1676-1700. 10.1093/brain/awu082 - DOI - PubMed
    1. Bartholomä A. and Nave K.-A. (1994). NEX-1: a novel brain-specific helix-loop-helix protein with autoregulation and sustained expression in mature cortical neurons. Mech. Dev. 48, 217-228. 10.1016/0925-4773(94)90061-2 - DOI - PubMed
    1. Beggs H. E., Schahin-Reed D., Zang K., Goebbels S., Nave K.-A., Gorski J., Jones K. R., Sretavan D. and Reichardt L. F. (2003). FAK deficiency in cells contributing to the basal lamina results in cortical abnormalities resembling congenital muscular dystrophies. Neuron 40, 501-514. 10.1016/S0896-6273(03)00666-4 - DOI - PMC - PubMed
    1. Bellis S. L., Miller J. T. and Turner C. E. (1995). Characterization of tyrosine phosphorylation of paxillin in vitro by focal adhesion kinase. J. Biol. Chem. 270, 17437-17441. 10.1074/jbc.270.29.17437 - DOI - PubMed

MeSH terms