. 2017 Oct 13;358(6360):eaao2602.
doi: 10.1126/science.aao2602. Epub 2017 Sep 21.

The microanatomic segregation of selection by apoptosis in the germinal center

Affiliations

The microanatomic segregation of selection by apoptosis in the germinal center

Christian T Mayer et al. Science. .

Abstract

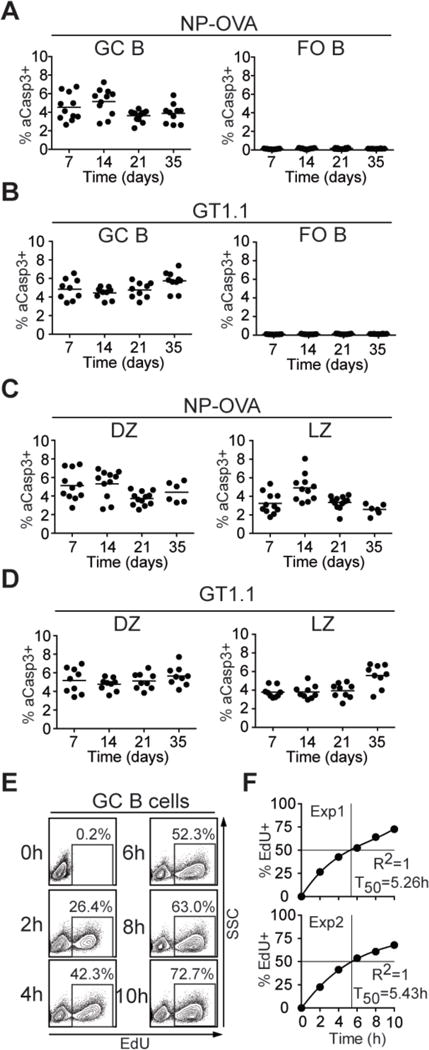
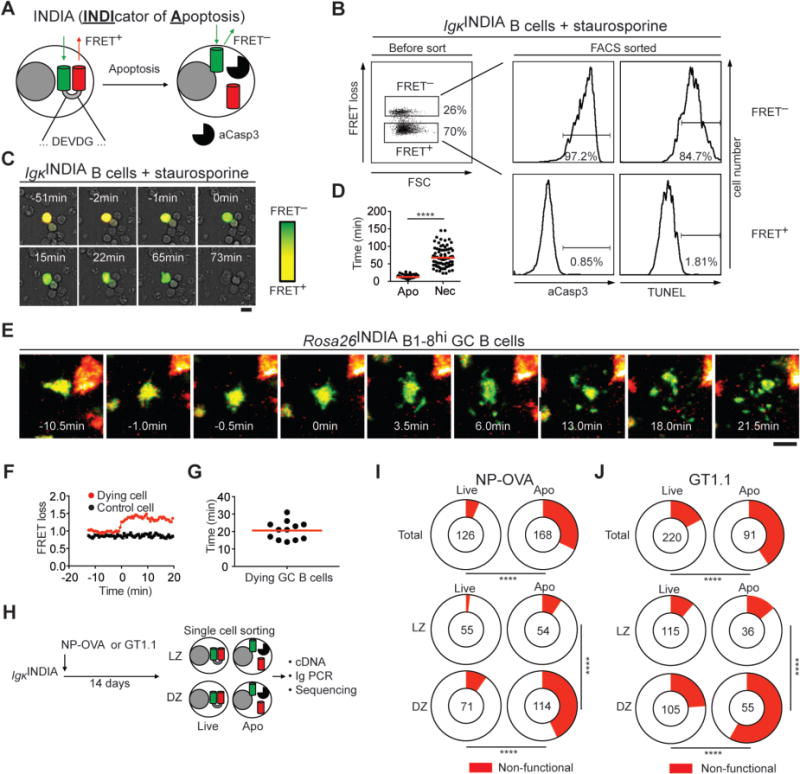
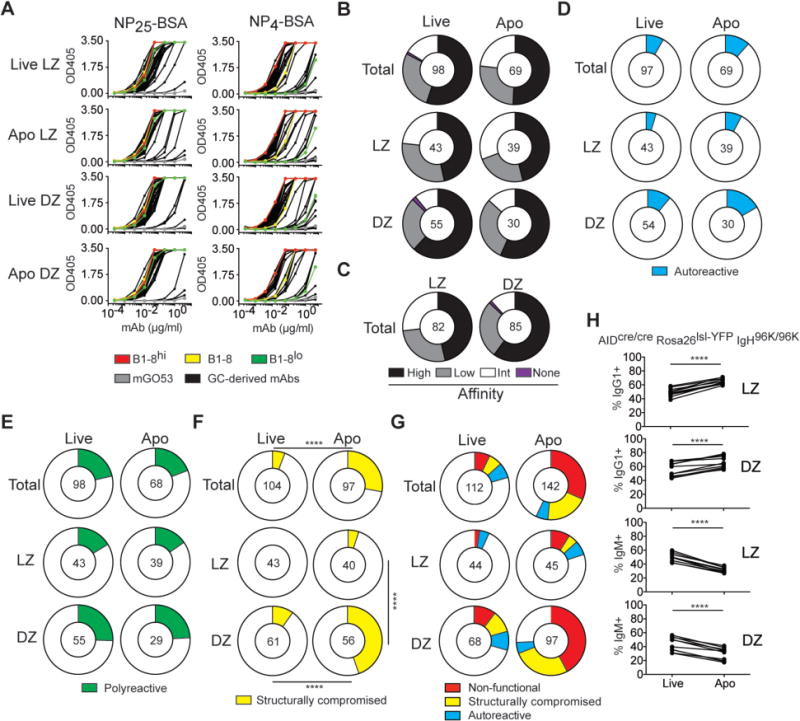
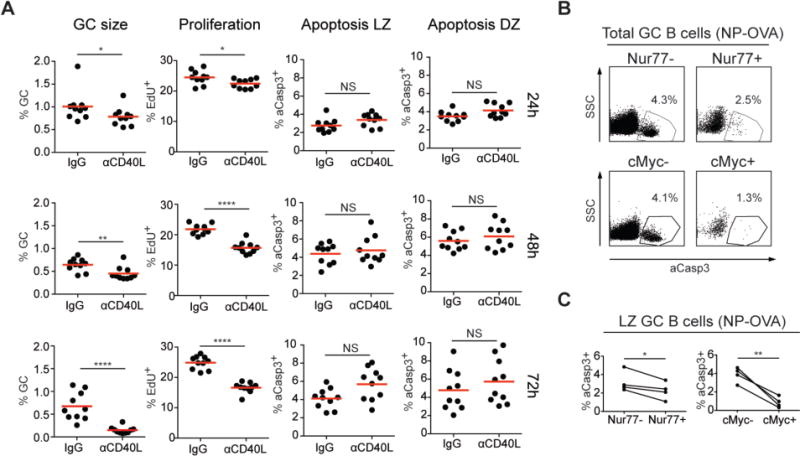
B cells undergo rapid cell division and affinity maturation in anatomically distinct sites in lymphoid organs called germinal centers (GCs). Homeostasis is maintained in part by B cell apoptosis. However, the precise contribution of apoptosis to GC biology and selection is not well defined. We developed apoptosis-indicator mice and used them to visualize, purify, and characterize dying GC B cells. Apoptosis is prevalent in the GC, with up to half of all GC B cells dying every 6 hours. Moreover, programmed cell death is differentially regulated in the light zone and the dark zone: Light-zone B cells die by default if they are not positively selected, whereas dark-zone cells die when their antigen receptors are damaged by activation-induced cytidine deaminase.


Figures

Fig. 1
Fig. 1. Quantitation of cell death in GC B cells
(A-D) C57BL/6J mice were immunized subcutaneously with NP-OVA or GT1.1 precipitated in alum and analyzed after 7, 14, 21, and 35 d. Percentages of aCasp3+ GC B cells and FO B cells (left and right, respectively) after (A) NP-OVA or (B) GT1.1 immunization. Percentages of aCasp3+ cells in CXCR4hiCD86lo (DZ, left) and CXCR4loCD86hi (LZ, right) after (C) NP-OVA or (D) GT1.1 immunization. In A-D, each dot represents one mouse. (E, F) EdU incorporation into Peyer’s patch GC B cells measured by flow cytometry at the indicated time points after EdU administration every 2 h. (E) Representative flow cytometry plots show EdU and side scatter (SSC). (F) Plots show fraction of EdU+ GC B cells vs. time. T50 represents the interpolated time (cubic fit) where 50% of GC B cells incorporated EdU. Data are from at least two independent experiments each involving 2-5 mice for every time point.
Fig. 2
Fig. 2. Cell death dynamics and selection against BCR loss
(A) Schematic representation of the apoptosis indicator. (B) Flow cytometry of LPS/IL-4-activated IgκINDIA B cells incubated with staurosporine for 3 h. Dot plot shows forward scatter (FSC) and FRET loss of mRuby2+ cells. Histograms show aCasp3 or TUNEL staining on purified FRET+ and FRET cells. (C) Representative images of LPS/IL-4-activated IgκINDIA B cells showing FRET loss as increased green fluorescence over time after addition of staurosporine (scale bar: 10 μm). (D) Time from initiation of FRET loss (synchronized to 0 min) to signs of apoptosis (Apo) or necrosis (Nec; Apo: n = 70 cells; Nec: n = 82 cells; **** p < 0.0001, two-tailed Mann-Whitney U test). (E-G) Intravital imaging of B1-8hiRosa26INDIA GC B cells in lymph nodes of NP-OVA immunized mice. (E) Collapsed Z-stacks of 75-μm depth showing FRET loss and disintegration of a GC B-cell over time. (F) FRET loss ratios tracked over time (red, the dying cell in (E); black, a live GC B-cell in the same imaging volume). (G) Time from FRET loss to GC B-cell fragmentation. (H-J) Paired IgH/Igλ or IgH/I sequences from single IgκINDIA live and apoptotic GC LZ and DZ B cells purified from NP-OVA- or GT1.1-immunized mice. (H) Schematic representation of the experiment. (I, J) Pie charts show the fraction of non-functional BCRs (red) in live and apoptotic GC B cells (top) or in LZ and DZ (bottom) after (I) NP-OVA and (J) GT1.1 immunization. Number in the center indicates the number of Ig pairs analyzed. Data are from at least two independent experiments in all cases. **** p < 0.0001; Fisher’s exact test.
Fig. 3
Fig. 3. Binding properties of GC-derived IgHV1-72 Igλ antibodies
(A) ELISAs show monoclonal antibody binding to NP25-BSA (left) or NP4-BSA (right); NP-specific control antibodies (B1-8hi, high-affinity, red; B1-8 germline, intermediate-affinity, yellow; B1-8lo, low-affinity, green) and mGO53 (negative control, grey) are included. (B) Pie charts show the percentage of high-, low-, and intermediate-affinity antibodies in each GC compartment (NP4/NP25 ratio = 1, black; < B1-8 germline, grey; > B1-8 germline < 1; white), or no NP binding (magenta). (C) Same as (B) but for all LZ and DZ cells irrespective of cell death. (D) Percentage of antibodies binding to self-antigens in HEp2 ELISA (cyan). (E) Percentage of polyreactive antibodies (green). (F) Percentage of structurally compromised antibodies that cannot be secreted by transfected HEK293-6E cells (yellow). (G) Summary of negative selection in GCs. Percentage of non-functional BCRs (see Fig. 2I), structurally compromised BCRs (yellow slice), and autoreactive BCRs (cyan slice) in each GC B-cell compartment. (B-G) The number in the center of the pie charts represents the number of antibodies tested. (H) Graphs show the fraction of IgG1+ and IgM+ live and apoptotic Peyer’s patch DZ and LZ GC B cells in AIDCre/CreRosa26lsl-YFPIgH96K/96K mice as determined by aCasp3 staining. Results are combined from two independent experiments each involving 3-5mice. **** p < 0.0001; paired Student’s t-test.
Fig. 4
Fig. 4. Apoptosis in the GC LZ
(A) Graphs show the fraction of GC B cells among CD19+ B cells (left column), fraction of EdU+ GC B cells (second column) and fraction of aCasp3+ cells in GC LZ and DZ (right columns) in the draining lymph nodes of C57BL/6J mice 14 d after NP-OVA immunization. Hamster IgG or α-CD40L was injected 24 h, 48 h or 72 h before analysis. Results are combined from two independent experiments each with five mice per condition. * p = 0.037 (24 h, GC size), * p=0.0215 (24 h, proliferation), ** p = 0.0048, **** p < 0.0001, NS p > 0.05 (not statistically significant); two-tailed Mann-Whitney U test. (B, C) Analysis of apoptosis in GC B cells in Nur77-GFP or Myc-GFP mice 14 d after immunization with NP-OVA. (B) Representative flow cytometry plots show the frequency of aCasp3+ cells in Nur77-GFP and Nur77-GFP+ (top) and in Myc-GFP and Myc-GFP+ GC B cells (bottom). (C) The frequency of aCasp3+ cells in Nur77-GFP and Nur77-GFP+ (left graph), or Myc-GFP and Myc-GFP+ LZ GC B cells (right graph). (B, C) Two to three independent experiments each involving 3-6 Nur77-GFP or Myc-GFP mice with three mice pooled per data set. Nur77-GFP, * p = 0.0355; Myc-GFP, ** p = 0.006; paired Student’s t-test.

Comment in

Similar articles

Cited by

References

    1. Victora GD, et al. Germinal center dynamics revealed by multiphoton microscopy with a photoactivatable fluorescent reporter. Cell. 2010;143:592–605. - PMC - PubMed
    1. Gitlin AD, Shulman Z, Nussenzweig MC. Clonal selection in the germinal centre by regulated proliferation and hypermutation. Nature. 2014;509:637–640. - PMC - PubMed
    1. Allen CD, Okada T, Tang HL, Cyster JG. Imaging of germinal center selection events during affinity maturation. Science. 2007;315:528–531. - PubMed
    1. Hauser AE, et al. Definition of germinal-center B cell migration in vivo reveals predominant intrazonal circulation patterns. Immunity. 2007;26:655–667. - PubMed
    1. Robbiani DF, et al. Plasmodium Infection Promotes Genomic Instability and AID-Dependent B Cell Lymphoma. Cell. 2015;162:727–737. - PMC - PubMed

Publication types

MeSH terms

Substances