. 2017 Sep 21;8(1):651.
doi: 10.1038/s41467-017-00310-3.

Sensorimotor computation underlying phototaxis in zebrafish

Affiliations

Sensorimotor computation underlying phototaxis in zebrafish

Sébastien Wolf et al. Nat Commun. .

Abstract

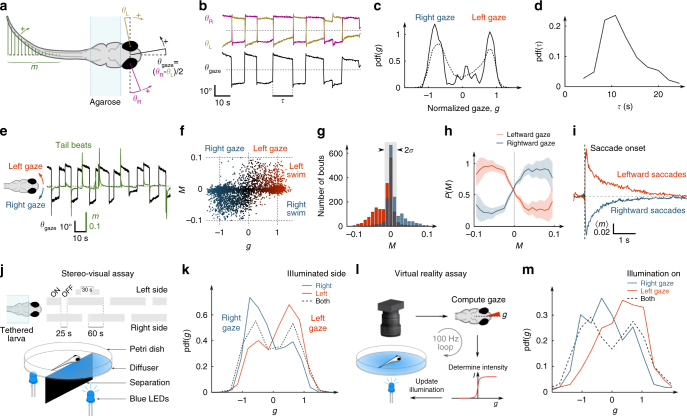
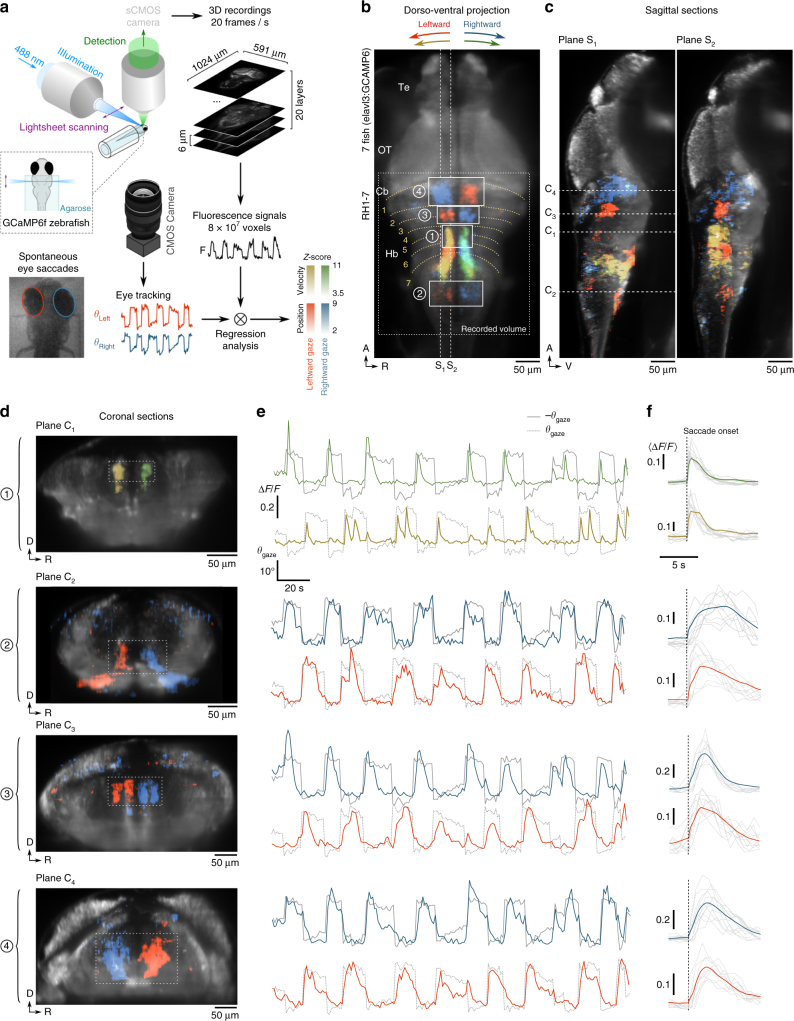
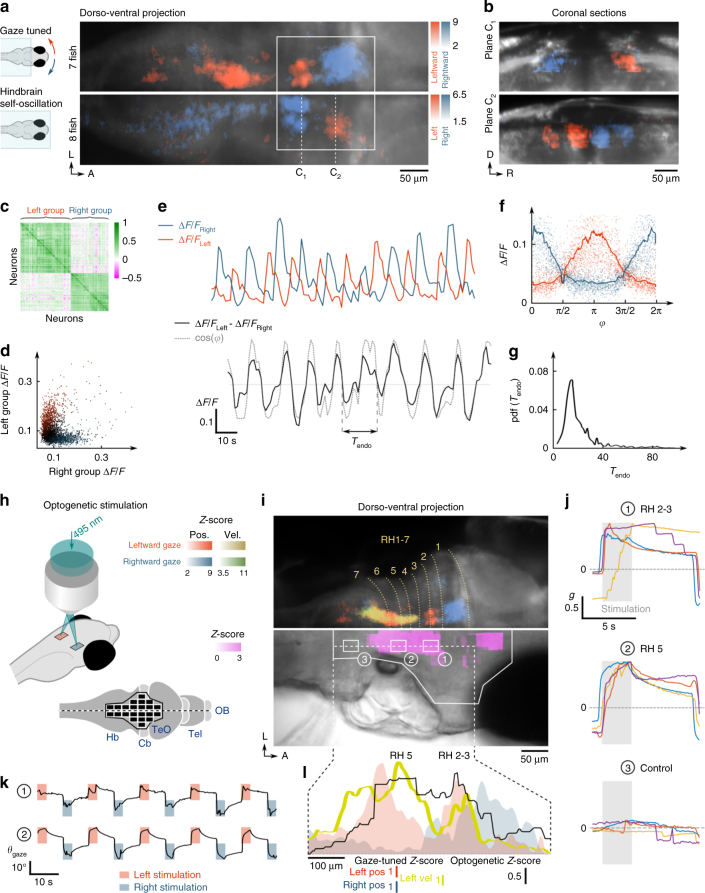
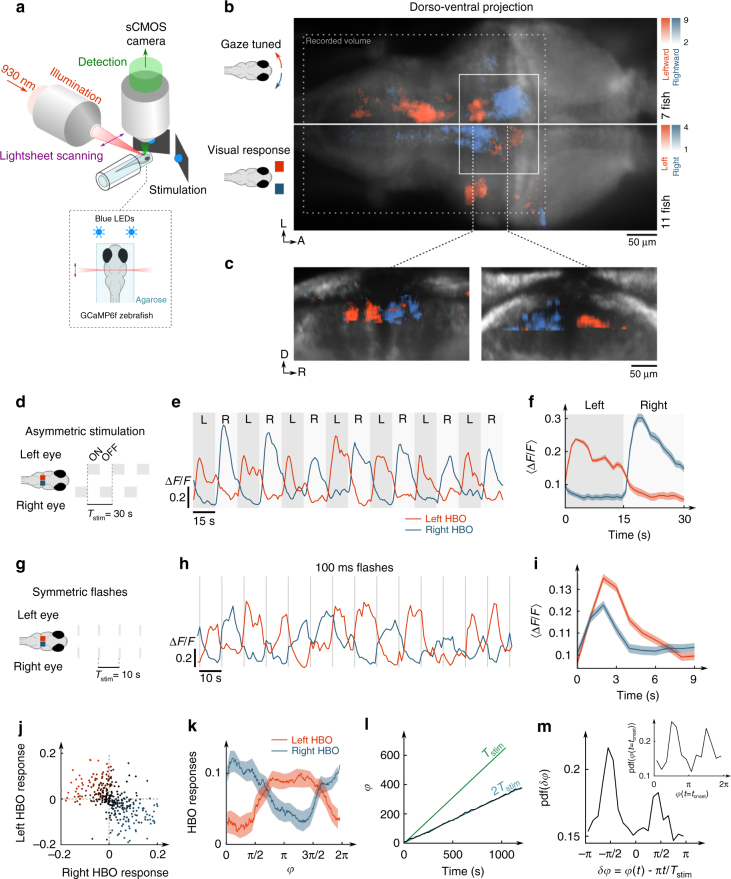
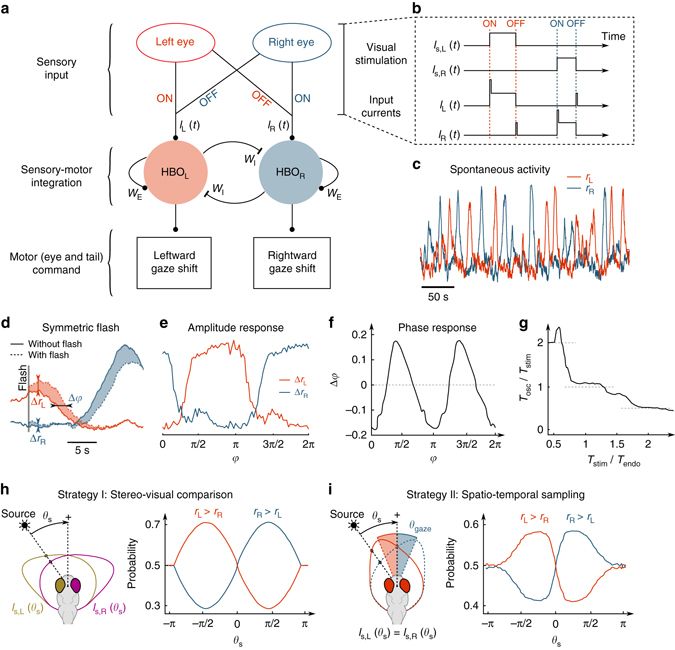
Animals continuously gather sensory cues to move towards favourable environments. Efficient goal-directed navigation requires sensory perception and motor commands to be intertwined in a feedback loop, yet the neural substrate underlying this sensorimotor task in the vertebrate brain remains elusive. Here, we combine virtual-reality behavioural assays, volumetric calcium imaging, optogenetic stimulation and circuit modelling to reveal the neural mechanisms through which a zebrafish performs phototaxis, i.e. actively orients towards a light source. Key to this process is a self-oscillating hindbrain population (HBO) that acts as a pacemaker for ocular saccades and controls the orientation of successive swim-bouts. It further integrates visual stimuli in a state-dependent manner, i.e. its response to visual inputs varies with the motor context, a mechanism that manifests itself in the phase-locked entrainment of the HBO by periodic stimuli. A rate model is developed that reproduces our observations and demonstrates how this sensorimotor processing eventually biases the animal trajectory towards bright regions.Active locomotion requires closed-loop sensorimotor co ordination between perception and action. Here the authors show using behavioural, imaging and modelling approaches that gaze orientation during phototaxis behaviour in larval zebrafish is related to oscillatory dynamics of a neuronal population in the hindbrain.


Conflict of interest statement

The authors declare no competing financial interests.

Figures

Fig. 1
Fig. 1
Behavioural assays of ocular-saccade–turning-bout coordination and light-induced gaze bias. a Definition of the eye and tail kinematic parameters. The larva’s tail and eyes are free. The gaze angle, θ gaze, is defined as the mean orientation of both eyes. The parameter m characterises the instantaneous tail deflection (Supplementary Methods). bd Gaze dynamics. b Example time-traces of the eye and gaze angles. c Probability distribution function (PDF) of the gaze angle, normalised by its characteristic range (Supplementary Methods), for one fish (solid line) and for N = 29 fish (dashed line). d PDF of the delay τ between successive reorienting saccades for one fish. ei Ocular-saccade–tail-beat coordination. e Gaze angle and tail deflection signals. f Individual tail-beats turning score M, defined as the integral of m(t) over the swim-bout (Supplementary Methods), vs. the normalised gaze angle g (3681 tail-beats, N = 11 fish). g Histograms of M for leftward (red) and rightward (blue) gaze orientation. The central part of the distribution (standard deviation σ) is used to assess the significance of the tail-bout orientational bias. h Conditional probability of the gaze to be orientated to the left (red) or right (blue) given the tail-beat turning score M (3681 tail-beats, N = 11 fish). The shaded region corresponds to the s.e.m. i Mean peri-saccadic tail deflection signal averaged over leftward (blue) and rightward (red) saccades. j, k Stereo-visual phototaxis. j Scheme of the experimental assay. k PDF of the normalised gaze during periods of unilateral stimulation for animals displaying positive phototaxis (N = 18 fish). Red and blue curves correspond to illumination on the left and right eye, respectively. Dashed curve indicates bilaterally symmetric illumination. l, m Spatio-temporal gaze phototaxis. l Scheme of the virtual-reality assay. The fish is submitted to a uniform illumination whose intensity is driven in real-time by the animal’s gaze angle. m PDF of the normalised gaze angle for virtual leftward (red) and rightward (blue) illumination (N = 13 fish). The dashed curve corresponds to the neutral runs (constant illumination)
Fig. 2
Fig. 2
Regression-based identification of gaze-tuned neuronal populations. a Schematic of the experimental setup and regression analysis. Volumetric recordings on GCaMP6f-expressing larvae were performed using one-photon light-sheet imaging (20 sections per stack, 1 stack per second) while monitoring saccadic dynamics. Voxel-by-voxel regression with the eye orientation signals were used to produce position-tuned and velocity-tuned 3D maps. Notice that the two maps overlap in a small subset of voxels (the two 3D maps are displayed separately in Supplementary Movie 3). b, c Dorso-ventral projection view and sagittal sections along two planes of the 3D functional map (mean over 7 fish) showing neuronal populations whose activity is tuned to the gaze orientation (blue and red) and to the gaze angular velocity (green and yellow). The voxel colour encodes the Z-score values obtained through multilinear regression (Supplementary Methods). Te, telencephalon; OT, optic tectum; Cb, cerebellum; Hb, hindbrain; RH, rhombomere. The grey dotted rectangle indicates the effective recorded volume. d Coronal sections along the dotted lines shown in (c) for one sample of the four regions delineated in (b). Region 1 encompasses the saccade generator burst neurons (SGBN); region 2 is the velocity-position neural integrator (VPNI); region 3 and 4 constitute the newly identified gaze-tuned rostral hindbrain population. It consists of four bilaterally symmetric clusters tuned to the ipsiversive gaze orientation (region 3) and 2 more rostral clusters tuned to the contraversive gaze angle (region 4). e Example ΔF/F time-traces for these four regions. The red and yellow (respectively blue and green) traces correspond to the sub-populations tuned to leftward (respectively rightward) gaze orientation. The grey lines are the gaze angle traces (−θ gaze: solid line, θ gaze: dashed line). f Corresponding mean peri-saccade ΔF/F signals, computed over the leftward (red) and rightward (blue) saccades. Grey lines are peri-saccadic signals for individual saccades
Fig. 3
Fig. 3
Self-oscillatory dynamics and optogenetically evoked saccades. a Dorso-ventral projection of the gaze-tuned (top-half, N = 7 fish) and self-oscillatory hindbrain population (bottom-half, N = 8 eye-fixed fish). In the latter, the colour encodes tuning to the left (red) and right (blue) pre-selected neuronal clusters, revealing strong antiphasic activity (Supplementary Methods). The two functional maps were registered on the same reference brain to enable side-by-side comparison. The rectangle indicates the region of the rostral hindbrain gaze-tuned population. b Coronal sections of the self-oscillatory population along the dotted lines in the projected view. c Pearson correlation matrix of the neurons engaged in the self-oscillatory dynamics (616 neurons). The matrix was reordered to reveal two highly correlated (and reciprocally anti-correlated) clusters. d Activity of the left vs. right populations (r = −0.43). e Example ΔF/F traces of the left and right groups (top), and of the differential signal (bottom). The grey dotted line shows cos(φ(t))), where φ(t) is the oscillatory phase extracted using Hilbert’s transform. f ΔF/F of the right (blue) and left (red) circuits as a function of the oscillatory phase. The blue and red lines correspond to the mean values. g PDF of the instantaneous oscillation period. hk Optogenetic activation of ocular saccades. h Schematic of the optogenetic stimulation protocol. i Top: projective view of the previously mapped gaze-tuned regions. Bottom: Z-score map of saccadic entrainment by optogenetic activation averaged over 8 fish (Supplementary Methods). j Mean peri-stimulation normalised gaze signal for three regions: the rostral HBO (rh 2–3), the SGBN (rh 5), a control region (rh 7). The responses of four different fish are shown, and the associated targeted areas are indicated in (i). The 2.75 s-long stimulation periods are indicated by the grey area. k Example gaze signals upon periodic left or right optogenetic stimulation for two region pairs in rh 2–3 and rh 5. l Profile plot of the mean optogenetic Z-score along the rostro-caudal axis (black), overlaid on the ipsiversive (red) and contraversive (blue) gaze-tuned Z-score yellow curve indicates the ipsiversive velocity-tuned Z-score. Ipsiversive saccades are evoked with comparable efficiency by targeting the SGBN (rh 5) or the rostral HBO (rh 2–3)
Fig. 4
Fig. 4
Response of the HBO to asymmetric and symmetric visual stimuli. a Schematic of the two-photon light-sheet imaging setup with stereo-visual stimulation. b Comparison of the gaze-tuned and visual response projection maps. Top: the red and blue colours encode leftward and rightward gaze-tuning Z-score, respectively (N = 7 fish). Bottom: the red and blue colours encode the visual response Z-score (Supplementary Methods) to unilateral stimulation on the left and right eye, respectively (N = 11 fish). The HBO circuit (white rectangle) is engaged in both sensory and motor processing. c Coronal sections of the visual response map along the two dotted lines shown in (a). In (b) the dotted rectangle delineates the recorded volume. d Alternated unilateral visual stimulation. e Example traces of left and right HBO. f Trial-averaged response of the HBO over 20 stimulation periods. Shaded regions correspond to left (dark grey) and right (pale grey) illumination. g Bilaterally symmetric 100 ms-long flashes. h Example traces of the right and left HBO. The grey lines indicate the flashes. i Trial-averaged flash-induced responses of each subpopulation (100 flashes). j Left vs. right HBO responses (1311 flashes, N = 12 fish, r = −0.5). k Phase-dependent response of each subpopulation to symmetric flashes. l Time-evolution of the HBO oscillatory phase φ(t). The slope of the green line corresponds to the stimulation frequency (period T stim = 10 s). The HBO is entrained at half the frequency of the stimulation (period 2T stim). m PDF of the HBO stimulation phase offset δφ. The inset shows the PDF of the HBO phase at times where the flashes were delivered. Notice that in (f), (i) and (k), the error bars indicate the s.e.m
Fig. 5
Fig. 5
Phase-locking and frequency entrainment of the HBO by periodic visual stimuli. a Example HBO signals during symmetric visual stimulus presentation consisting of alternating light-ON and light-OFF periods of similar duration. Difference of the left and right HBO signals for five stimulation frequencies. Light-ON periods are indicated by the shaded areas. b Time-evolution of the HBO phase signal demonstrating frequency entrainment by periodic visual stimuli. The green line indicates the phase evolution of the stimulation. The HBO is entrained at half the frequency for T stim = 10 s, and twice the frequency for T stim = 60 s. c The HBO stimulation phase offset displays a non-uniform distribution, revealing phase-locking (Rayleigh test, p < 0.01). df Frequency entrainment by symmetric stimulation. d Symmetric stimulation schematic. e HBO oscillatory period T osc as a function of the stimulation period T stim (N = 5 fish, red points show the data presented in (ac)). The dotted line shows the T osc = T stim entrainment curve. f Entrainment ratio T osc/T stim as a function of T stim (N = 5 fish). gi Frequency entrainment by asymmetric stimulation (N = 11 fish). The shaded areas in (f) and (i) are guides to the eye showing the approximate domain of one-to-one frequency entrainment in each configuration. In (e, f) and (h, i), the error bars represent the s.e.m
Fig. 6
Fig. 6
A rate model of the HBO’s visually entrained dynamics leading to phototaxis. a, b Schematic of HBO network connectivity. Visual stimuli are relayed to the HBO via the ON and OFF pathways, as detailed in (b). The HBO activity controls gaze shifts via ocular saccades and turning bouts. Self-oscillatory dynamics result from the recurrent excitation (W E), reciprocal inhibition (W I) and adaptation currents (Supplementary Methods). c Example traces of the endogenous antiphasic oscillations of the left and right HBO in the absence of varying visual stimulation (arbitrary units). d Response of the HBO to a symmetric flash. The shaded areas display the difference in activity induced by the flash, from which we extract an amplitude response for each circuit and a flash-induced phase offset. e, f Mean amplitude and phase response to symmetric flashes as a function of the HBO phase at stimulation. g Frequency entrainment curve for symmetric periodic stimulations (light-ON–light-OFF alternation). The ratio of the oscillatory over the stimulation periods (T osc/T stim) is plotted as a function of T stim normalised by the endogenous period T endo. h Numerical implementation of a stereo-visual comparison strategy for phototaxis. Each eye receives a different intensity (I L(θ s) and I R(θ s)) set by the light source azimuth θ s. The red and blue curves show, as a function of θ s, the time fraction for which r L > r R and r R > r L, respectively. The light source reinforces the ipsilateral circuit leading to orientational positive phototaxis. i Spatio-temporal sampling strategy. Both eyes receive a similar intensity, which depends on the relative orientation of the gaze θ gaze and the light source azimuth θ s. The gaze orientation oscillates between two values according to θ gaze = sign(r L − r R)* 15°. As in (h), the left vs. right bias of the HBO as a function of θ s is consistent with positive phototaxis

Similar articles

Cited by

References

    1. Berg HC, Brown DA. Chemotaxis in Escherichia coli analysed by three-dimensional tracking. Nature. 1972;239:500–504. doi: 10.1038/239500a0. - DOI - PubMed
    1. Chalasani SH, et al. Dissecting a circuit for olfactory behaviour in Caenorhabditis elegans. Nature. 2007;450:63–70. doi: 10.1038/nature06292. - DOI - PubMed
    1. Ward A, Liu J, Feng Z, Xu XZS. Light-sensitive neurons and channels mediate phototaxis in C. elegans. Nat. Neurosci. 2008;11:916–922. doi: 10.1038/nn.2155. - DOI - PMC - PubMed
    1. Gomez-Marin A, Stephens GJ, Louis M. Active sampling and decision making in Drosophila chemotaxis. Nat. Commun. 2011;2:441. doi: 10.1038/ncomms1455. - DOI - PMC - PubMed
    1. Gepner R, et al. Computations underlying Drosophila photo-taxis, odor-taxis, and multi-sensory integration. Elife. 2015;4:e06229. doi: 10.7554/eLife.06229. - DOI - PMC - PubMed

Publication types

LinkOut - more resources