

Correlation profiling of brain sub-cellular proteomes reveals co-assembly of synaptic proteins and subcellular distribution
- PMID: 28935861
- PMCID: PMC5608747
- DOI: 10.1038/s41598-017-11690-3
Correlation profiling of brain sub-cellular proteomes reveals co-assembly of synaptic proteins and subcellular distribution
Abstract
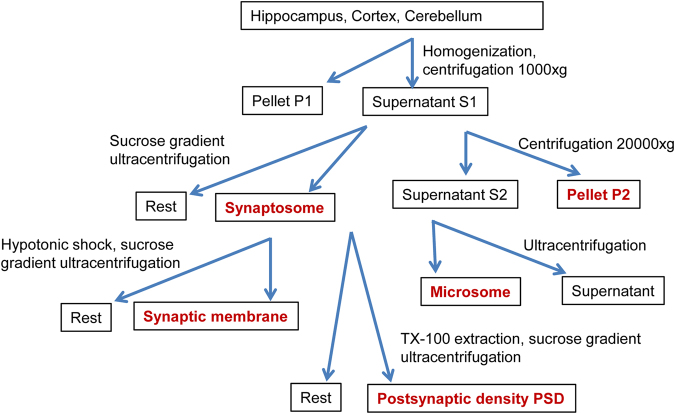
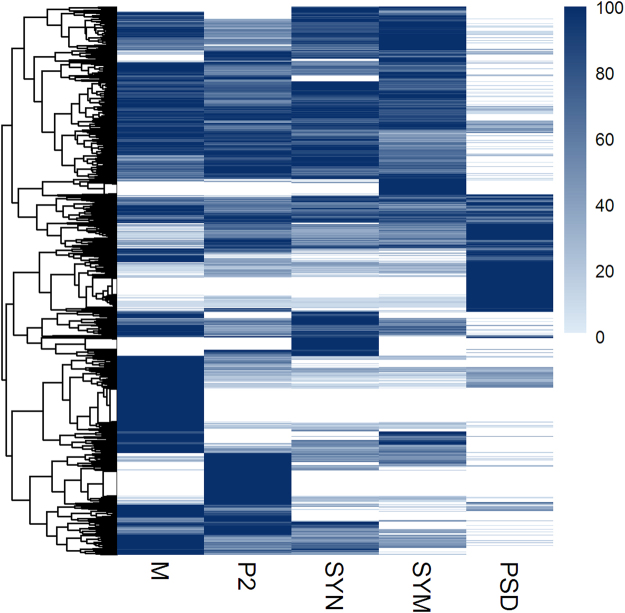
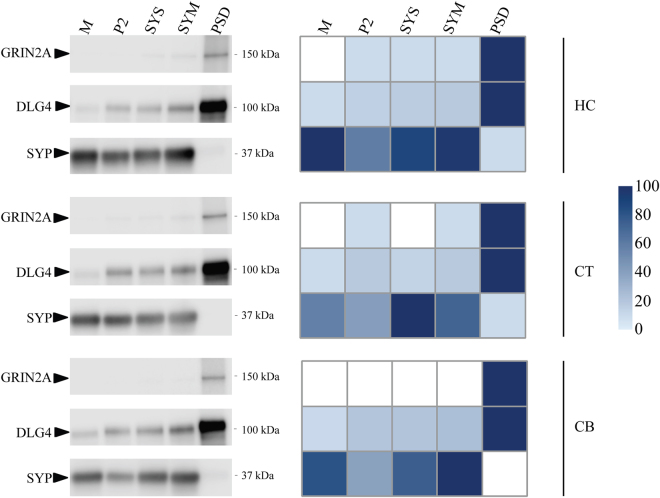
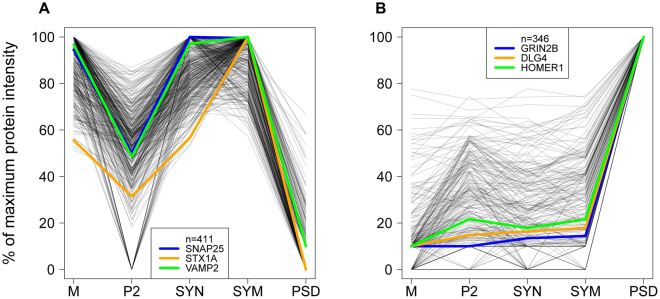
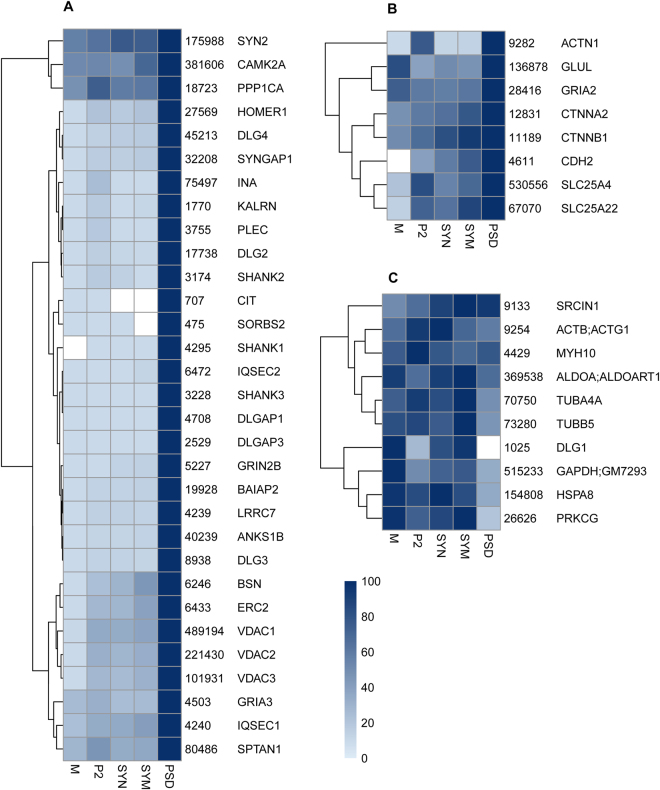
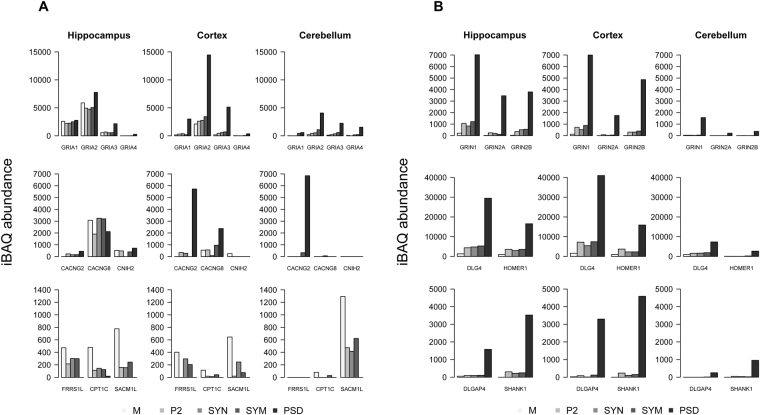
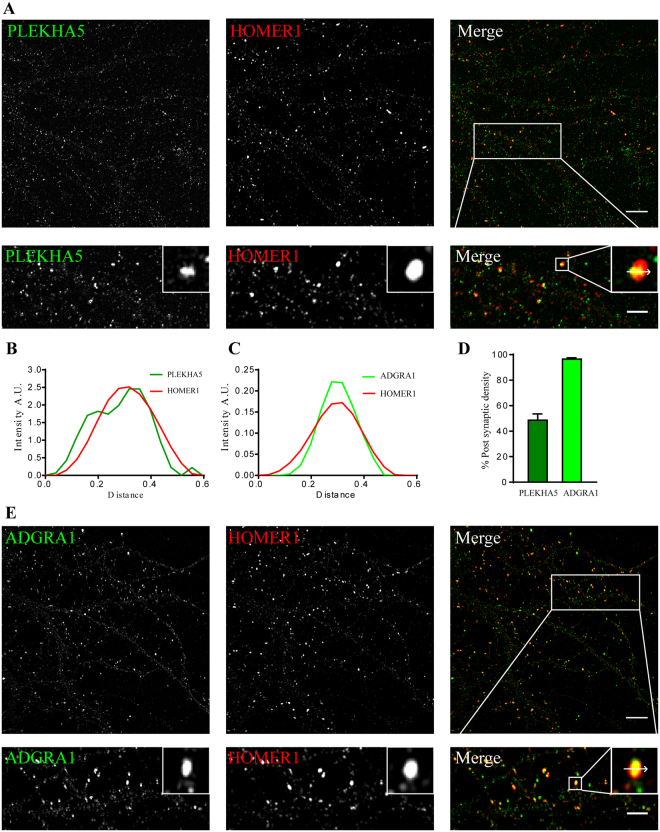
Protein correlation profiling might assist in defining co-assembled proteins and subcellular distribution. Here, we quantified the proteomes of five biochemically isolated mouse brain cellular sub-fractions, with emphasis on synaptic compartments, from three brain regions, hippocampus, cortex and cerebellum. We demonstrated the expected co-fractionation of canonical synaptic proteins belonging to the same functional groups. The enrichment profiles also suggested the presence of many novel pre- and post-synaptic proteins. Using super-resolution microscopy on primary neuronal culture we confirmed the postsynaptic localization of PLEKHA5 and ADGRA1. We further detected profound brain region specific differences in the extent of enrichment for some functionally associated proteins. This is exemplified by different AMPA receptor subunits and substantial differences in sub-fraction distribution of their potential interactors, which implicated the differences of AMPA receptor complex compositions. This resource aids the identification of proteins partners and subcellular distribution of synaptic proteins.
Conflict of interest statement
The authors declare that they have no competing interests.
Figures
Similar articles
-
Interaction proteomics reveals brain region-specific AMPA receptor complexes.J Proteome Res. 2014 Dec 5;13(12):5695-706. doi: 10.1021/pr500697b. Epub 2014 Nov 19. J Proteome Res. 2014. PMID: 25337787
-
Quantitative proteomic profiling of membrane proteins from the mouse brain cortex, hippocampus, and cerebellum using the HysTag reagent: mapping of neurotransmitter receptors and ion channels.Brain Res. 2007 Feb 23;1134(1):95-106. doi: 10.1016/j.brainres.2006.11.082. Epub 2007 Jan 17. Brain Res. 2007. PMID: 17207779
-
Spatial and sub-cellular localization of the membrane cytoskeleton-associated protein alpha-adducin in the rat brain.Brain Res. 1995 Nov 27;700(1-2):13-24. doi: 10.1016/0006-8993(95)00962-p. Brain Res. 1995. PMID: 8624703
-
Proteomics of the human brain: sub-proteomes might hold the key to handle brain complexity.J Neural Transm (Vienna). 2006 Aug;113(8):1041-54. doi: 10.1007/s00702-006-0513-7. Epub 2006 Jul 13. J Neural Transm (Vienna). 2006. PMID: 16835691 Review.
-
Proteomics methods for subcellular proteome analysis.FEBS J. 2013 Nov;280(22):5626-34. doi: 10.1111/febs.12502. Epub 2013 Sep 20. FEBS J. 2013. PMID: 24034475 Review.
Cited by
-
Synaptic proteins associated with cognitive performance and neuropathology in older humans revealed by multiplexed fractionated proteomics.Neurobiol Aging. 2021 Sep;105:99-114. doi: 10.1016/j.neurobiolaging.2021.04.012. Epub 2021 Apr 24. Neurobiol Aging. 2021. PMID: 34052751 Free PMC article.
-
Identification of substrates of palmitoyl protein thioesterase 1 highlights roles of depalmitoylation in disulfide bond formation and synaptic function.PLoS Biol. 2022 Mar 31;20(3):e3001590. doi: 10.1371/journal.pbio.3001590. eCollection 2022 Mar. PLoS Biol. 2022. PMID: 35358180 Free PMC article.
-
The endosomal protein sorting nexin 4 is a synaptic protein.Sci Rep. 2020 Oct 26;10(1):18239. doi: 10.1038/s41598-020-74694-6. Sci Rep. 2020. PMID: 33106523 Free PMC article.
-
The epilepsy-associated protein TBC1D24 is required for normal development, survival and vesicle trafficking in mammalian neurons.Hum Mol Genet. 2019 Feb 15;28(4):584-597. doi: 10.1093/hmg/ddy370. Hum Mol Genet. 2019. PMID: 30335140 Free PMC article.
-
Integrated multi-omic characterizations of the synapse reveal RNA processing factors and ubiquitin ligases associated with neurodevelopmental disorders.Cell Syst. 2025 Apr 16;16(4):101204. doi: 10.1016/j.cels.2025.101204. Epub 2025 Mar 6. Cell Syst. 2025. PMID: 40054464
References
Publication types
MeSH terms
Substances
LinkOut - more resources
Full Text Sources
Other Literature Sources
Molecular Biology Databases
