. 2017 Sep 22;8(1):624.
doi: 10.1038/s41467-017-00707-0.

Bioenergetic state regulates innate inflammatory responses through the transcriptional co-repressor CtBP

Affiliations

Bioenergetic state regulates innate inflammatory responses through the transcriptional co-repressor CtBP

Yiguo Shen et al. Nat Commun. .

Abstract

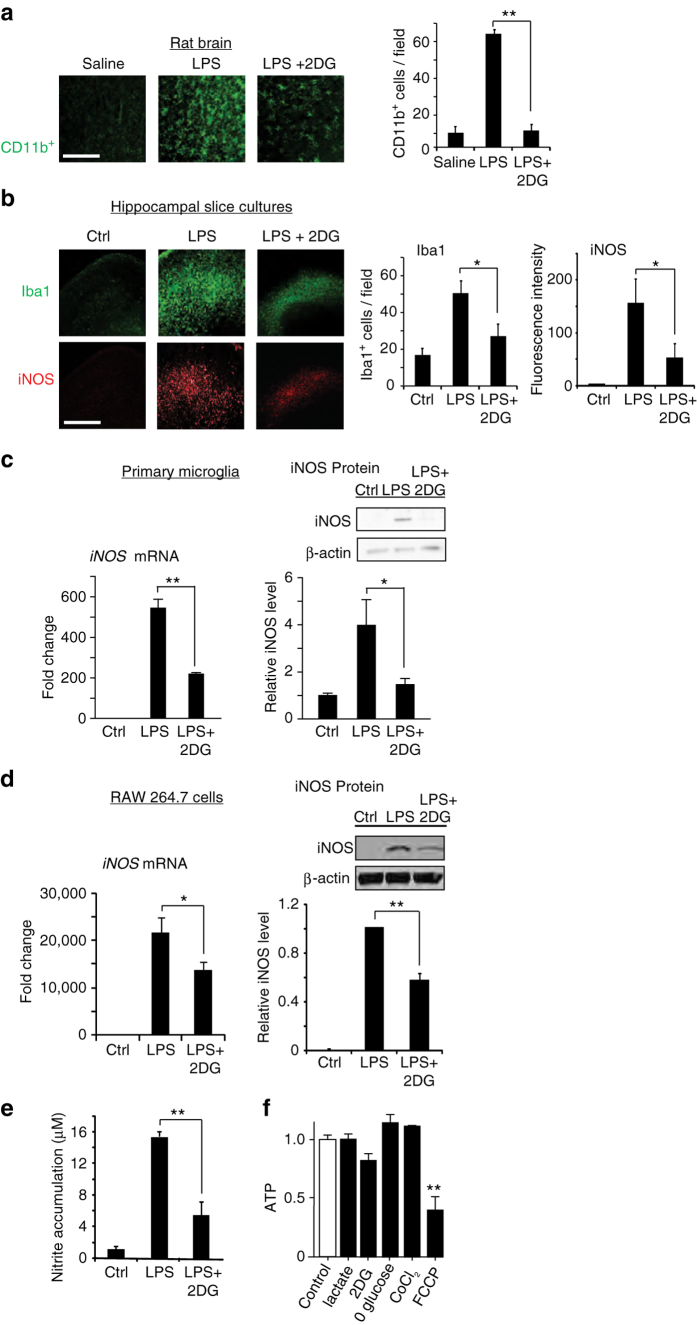
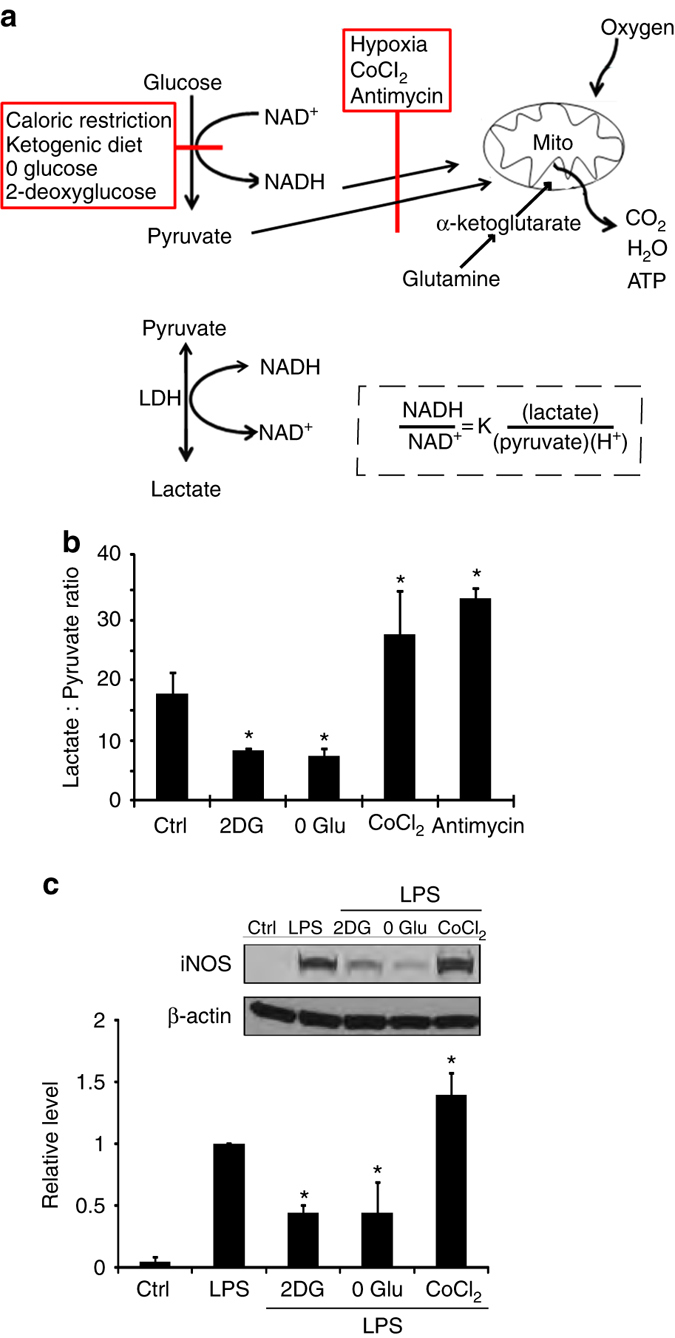
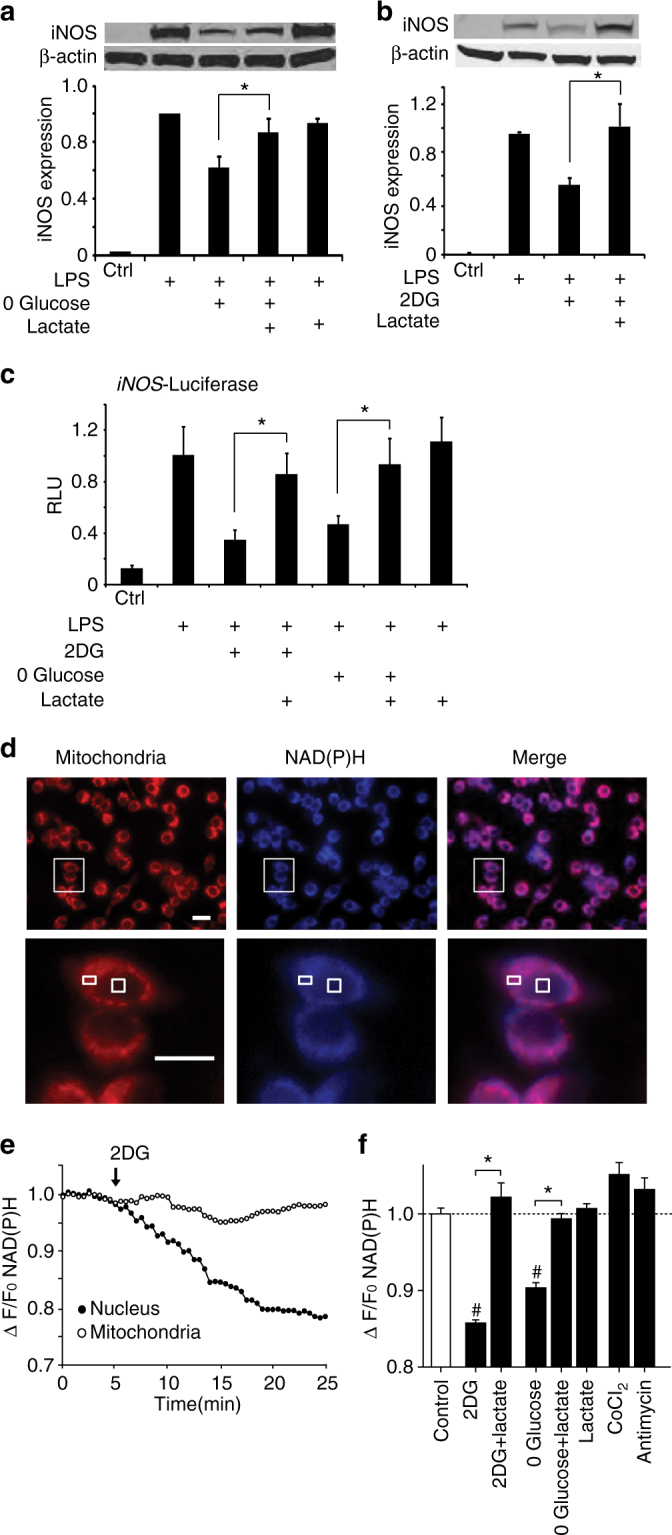
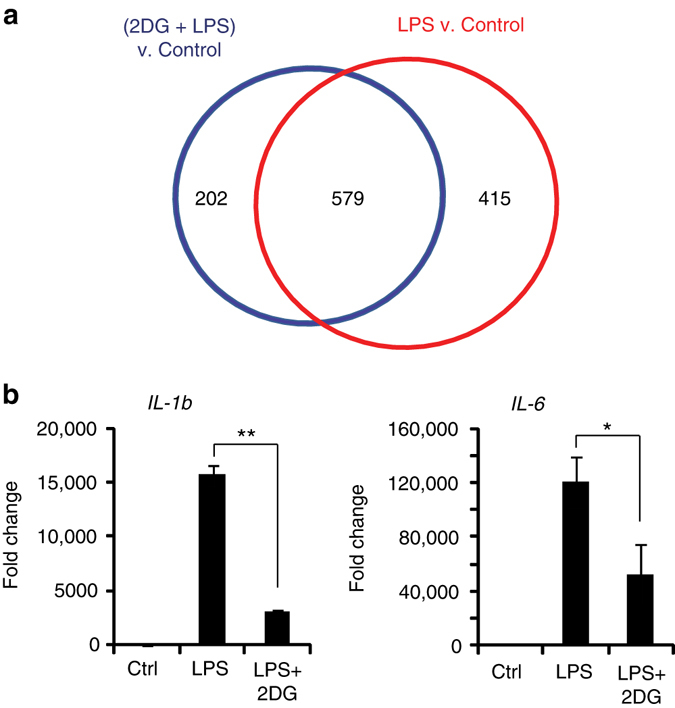
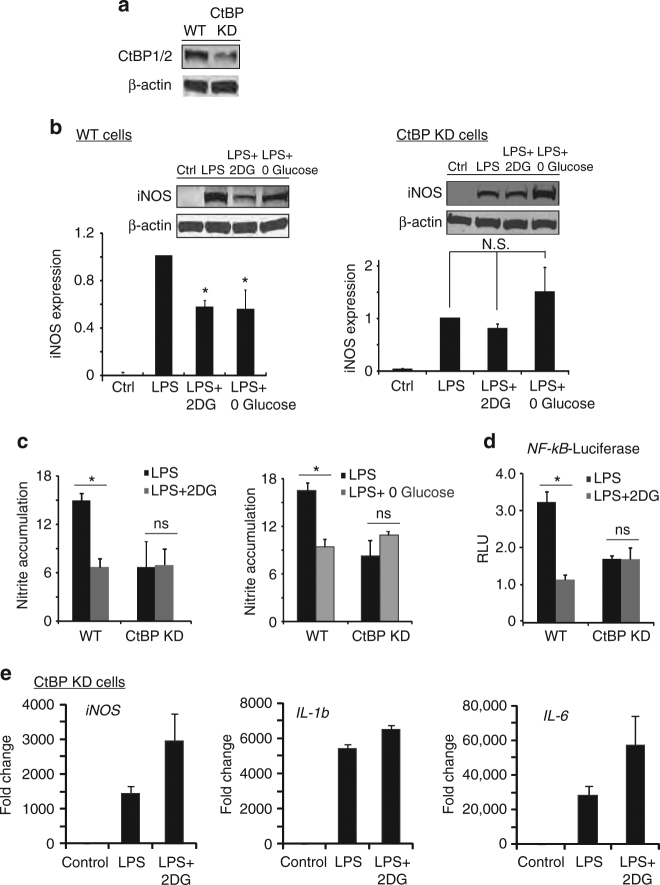
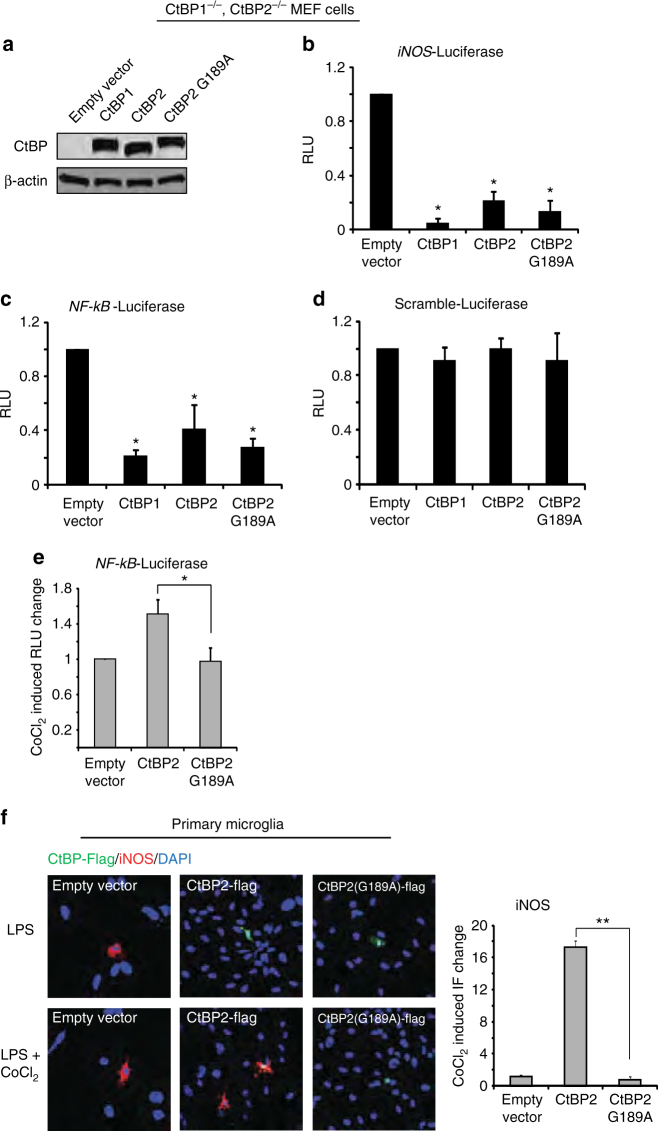
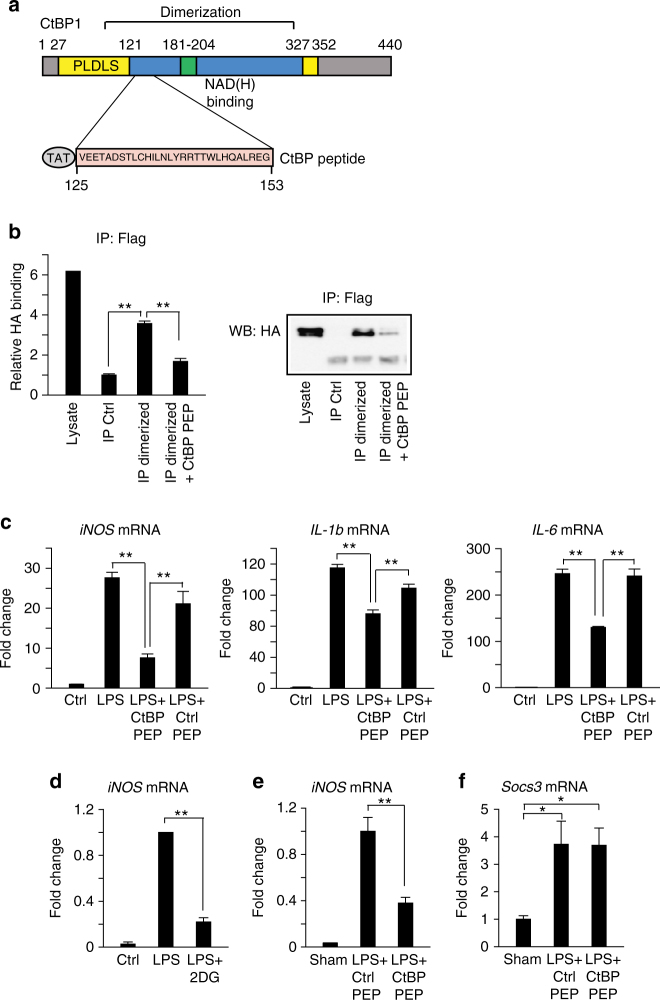
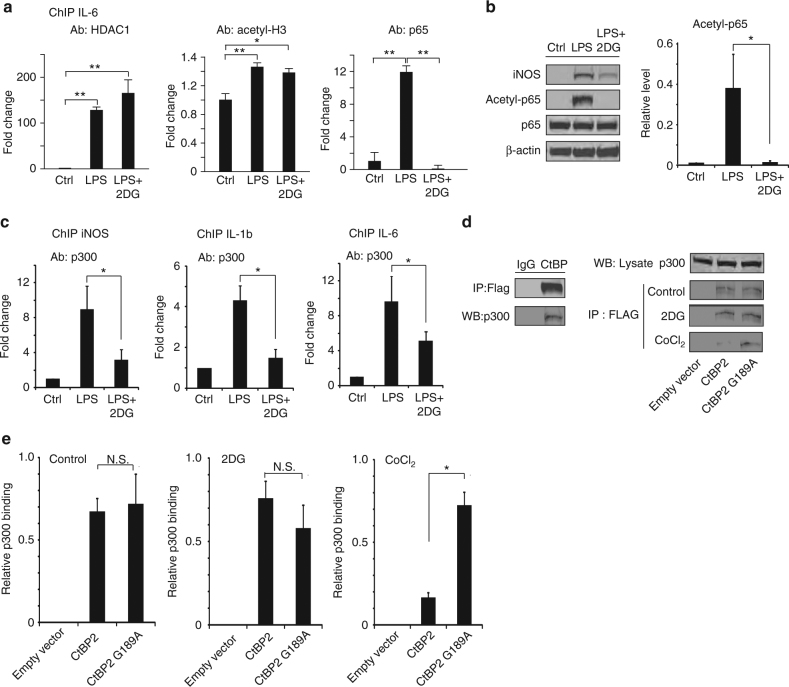
The innate inflammatory response contributes to secondary injury in brain trauma and other disorders. Metabolic factors such as caloric restriction, ketogenic diet, and hyperglycemia influence the inflammatory response, but how this occurs is unclear. Here, we show that glucose metabolism regulates pro-inflammatory NF-κB transcriptional activity through effects on the cytosolic NADH:NAD+ ratio and the NAD(H) sensitive transcriptional co-repressor CtBP. Reduced glucose availability reduces the NADH:NAD+ ratio, NF-κB transcriptional activity, and pro-inflammatory gene expression in macrophages and microglia. These effects are inhibited by forced elevation of NADH, reduced expression of CtBP, or transfection with an NAD(H) insensitive CtBP, and are replicated by a synthetic peptide that inhibits CtBP dimerization. Changes in the NADH:NAD+ ratio regulate CtBP binding to the acetyltransferase p300, and regulate binding of p300 and the transcription factor NF-κB to pro-inflammatory gene promoters. These findings identify a mechanism by which alterations in cellular glucose metabolism can influence cellular inflammatory responses.Several metabolic factors affect cellular glucose metabolism as well as the innate inflammatory response. Here, the authors show that glucose metabolism regulates pro-inflammatory responses through effects on the cytosolic NADH:NAD+ ratio and the NAD(H)-sensitive transcription co-repressor CtBP.


Conflict of interest statement

The authors declare no competing financial interests.

Figures

Fig. 1
Fig. 1
2-deoxyglucose suppresses LPS-induced microglial activation. a Immunostaining for CD11b identifies activated microglia in rat hippocampus. CD11b expression was increased 24 h after intraperitoneal injection with LPS (10 mg/kg). The increase was attenuated by co-injection with 2-deoxyglucose (2DG; 100 mg/kg). Scale bar = 100 µm. **p < 0.01, n = 6. b Immunostaining for Iba1 and iNOS identify activated microglia in mouse hippocampal slice cultures after 24 h incubation with LPS (10 μg/ml) or LPS + 2DG (1 mM). Scale bar = 100 µm; n ≥ 3, *p < 0.05. Culture medium contained 6 mM glutamine and 5 mM glucose. c Effects of 1 mM 2DG on LPS (10 ng/ml)—induced iNOS transcript and protein expression in primary microglial cultures. n = 5; *p < 0.05, **p < 0.01. Full length immunoblots are shown in Supplementary Fig. 3. d, e. Effects of 1 mM 2DG on LPS-induced iNOS protein expression, mRNA expression, and nitric oxide production in cultured RAW267.4 cells. n ≥ 3; *p < 0.05, **p < 0.01. f Relative ATP levels measured after 24 h incubation in control medium, 1 mM 2-deoxyglucose, 200 µm CoCl2, 20 mM lactate, glucose-free medium, or in 2 µm trifluorocarbonylcyanide phenylhydrazone (FCCP) as a positive control. n = 4; **p < 0.01 v. control. Error bars show s.e.m
Fig. 2
Fig. 2
Relationships between glucose metabolism and cytosolic NADH:NAD+ ratio. a Factors that reduce glucose flux through glycolysis, such as reduced glucose availability or glycolytic inhibitors, reduce NADH levels and thereby reduce NADH:NAD+ ratio, whereas factors that inhibit oxidative metabolism, such as hypoxia and mitochondrial inhibitors, have the opposite effect. Glutamine provides ketone bodies (α-ketoglutarate) to fuel mitochondrial ATP production in the absence of glycolysis. Lactate dehydrogenase (LDH) maintains the lactate:pyruvate ratio in equilibrium with the cytosolic NADH:NAD+ ratio. b The lactate:pyruvate ratio provides an index of the cytosolic NADH:NAD+ ratio in cells treated with glycolytic and mitochondrial inhibitors. 2DG, 1 mM 2-deoxyglucose; 0 Glu, glucose-free medium; CoCl2, 200 µm cobalt chloride; antimycin, 1 µm antimycin A. n = 4; *p < 0.05 v. control. c LPS-induced iNOS expression was suppressed in RAW267.4 cells treated with 1 mM 2DG or glucose-free medium, and increased in cells treated with the mitochondrial inhibitor cobalt chloride (CoCl2, 200 µm). n = 4; *p < 0.05 v. control. Error bars show s.e.m. Full length immunoblots are shown in Supplementary Fig. 3
Fig. 3
Fig. 3
Lactate reverses the effects of glycolytic inhibition on both cytosolic NADH levels and LPS-induced iNOS expression. a, b The effects of glucose-free medium and 2DG on LPS-induced iNOS expression are reversed by 20 mM lactate. n > 3, *p < 0.05. Full length immunoblots are shown in Supplementary Fig. 3. c The effects of glucose-free medium and 2DG on LPS-induced iNOS transcription are reversed by 20 mM lactate, as measured by relative light units (RLU) emitted by a cells transfected with a luciferase-coupled iNOS reporter gene. n = 3; *p < 0.05. d Effects of lactate on cytosolic NAD(P)H levels as measured by intrinsic fluorescence (blue). Mitochondria are labeled with Mitotracker (red). Lower row images are enlarged views of areas defined by rectangle in upper row. Boxes in lower row identify a mitochondria-rich peri-nuclear region and a mitochondria-free nuclear region in one cell. e Example of real-time NAD(P)H fluorescence changes recorded from these two regions during incubation with 1 mM 2-deoxyglucose (added at arrow). f Quantified results showing relative cytosolic NAD(P)H fluorescence changes induced by incubation with 1 mM 2-deoxyglucose ± 20 mM lactate, glucose-free medium ± 20 mM lactate, 20 mM lactate, 200 µm cobalt chloride, or 1 µm antimycin A. n = 5; *p < 0.01, # p < 0.01 v. control. Error bars show s.e.m
Fig. 4
Fig. 4
LPS and 2-deoxyglucose influence NF-κB—mediated gene transcription. a Microarray analysis identified 994 genes differentially regulated by LPS (red) and 781 genes by (2DG + LPS) (blue), relative to control conditions. 579 of LPS-response genes were affected by co-incubation with 2DG. b RT-PCR measures of NF-κB–driven pro-inflammatory cytokines confirmed that LPS-induced induction was attenuated by 2DG. IL-1b, interleukin-1beta; IL-6, interleukin-6. n ≥ 3; *p < 0.05, **p < 0.01. Error bars show s.e.m
Fig. 5
Fig. 5
Knockdown of CtBP eliminates the effects of 2DG and glucose-free medium. a Representative western blot showing reduced expression of CtBP1/2 protein in RAW264.7 cells transfected with shRNA targeting CtBP1 and CtBP2 (CtBP KD). Full length immunoblots are shown in Supplementary Fig. 3. b, c shRNA knockdown of CtBP1/2 negates the effect of both 2DG and glucose-free medium on LPS-induced iNOS expression and nitric oxide production. Results for wild-type (WT) cells were normalized to control (no LPS) WT cells, and results for CtBP knockdown cells (CtBP KD) were normalized to control CtBP KD cells. n = 4; *p < 0.05; ns, not significant. Error bars show S.E.M. d Knockdown of CtBP1/2 negates the effects of 2DG on LPS-induced NF-κB reporter gene activation. n ≥ 3; *p < 0.05; ns, not significant. Error bars show s.e.m. e 2DG did not suppress LPS-induced transcription of iNOS, Il-1b, or IL-6 in the CtBP KD cells. n = 3. (Compare to Figs. 1d, 4b)
Fig. 6
Fig. 6
The NAD(H) binding site on CtBP is required for its effect on inflammatory responses. a Transfection with CtBP1, CtBP2, and G1892 CtBP2 produced comparable expression levels in CtBP1−/−/CtBP2−/− MEF cells. Full length immunoblots are shown in Supplementary Fig. 3. bd MEF cells were transfected with WT CtBP1, CtBP2 and G189A CtBP2, and additionally transfected with p65 to induce NF-κB activation. All 3 CtBP constructs suppress iNOS and NF-κB reporter gene transcriptional activity, and have no effect on a scrambled-sequence driven luciferase reporter gene. n = 3; *p < 0.05 v. empty vector. e The mitochondrial inhibitor CoCl2 increased NF-κB reporter gene activity in cells expressing WT CtBP2 but not in cells expressing G189A CtBP2. Results are normalized to the increase produced by CoCl2 in the cells transfected with empty vector alone. n = 4; *p < 0.05. f Immunostaining in primary microglia shows LPS-induced iNOS expression is potentiated by CoCl2 in cells transfected with WT CtBP2, but not G189A CtBP. Larger nuclei in the images belong to the astrocyte feeder layer. Results are normalized to the increase produced by 200 µm CoCl2 in the empty vector—transfected cells. n = 4; **p < 0.01. Error bars show s.e.m
Fig. 7
Fig. 7
Direct inhibition of CtBP dimerization blocks LPS-induced pro-inflammatory gene expression. a Schematic of CtBP1 protein showing functional domains and alignment with the CtBP peptide used to block CtBP dimerization. PLDLS indicates substrate binding domain. The CtBP blocking peptide includes an N-terminal TAT sequence for cellular internalization. b Immunoprecipitation assay showing ability of CtBP peptide (50 µm) to block dimerization of tagged CtBP proteins incubated with 10 mM lactate + 10 µm NADH. Full length immunoblots are shown in Supplementary Fig. 3. Immunoprecipitation was performed with anti-Flag antibody, and CtBP1-Flag/CtBP1-HA heterodimers were detected by western blots using anti-HA antibody. Lysate control lane = 5% of input used in immunoprecipitated samples. n = 4. **p < 0.01. c CtBP peptide (5 µm) blocks LPS-induced mRNA expression of pro-inflammatory genes (iNOS, IL-1b and IL-6) in cultured primary microglia. Ctrl PEP = control peptide. n ≥ 3; **p < 0.01. d 2DG blocks LPS-induced iNOS gene expression in microglia isolated from mice after LPS (8 µg) injection into striatum. n = 3–5 per group. **p < 0.01. e, f CtBP peptide blocks LPS-induced iNOS expression but not Socs3 expression in brain microglia. n = 4 per group. **p < 0.01. Error bars show s.e.m
Fig. 8
Fig. 8
CtBP effects on p300 and NF-κB acetylation. a Chromatin immunoprecipitation (ChIP) with antibody to HDAC1, acetyl H3, and p65 was performed in RAW264.7 cells to evaluate binding to the IL-6 promoter regions. LPS increased all three signals, but only the effect of p65 binding was reversed by 2DG (conditions as in Fig. 1c); n = 3, *p < 0.05. b Western blots show LPS-induced p65 acetylation is suppressed by 2DG (conditions as in Fig. 1c); n = 3, *p < 0.05. Full length immunoblots are shown in Supplementary Fig. 3. c ChIP was performed to evaluate p300 binding to NF-κB p65 binding sites on promoter regions of pro-inflammatory cytokines. p300 binding was increased by LPS, and this effect was attenuated by 2DG (conditions as in Fig. 1c); n = 3, *p < 0.05. d HEK293 cells were transfected with FLAG-tagged WT CtBP2 or G189A CtBP2. Immunoprecipitation using antibody to FLAG recovered p300 protein, while antibody to IgG, used as a negative control, did not. Immunoprecipitates from transfected cells treated with 2DG or CoCl2 for 30 min showed reduced p300 binding to WT CtBP2, but not G189A CtBP2, in cells treated with CoCl2. e Quantified results of the immunoprecipitation studies. Results were normalized to p300 in the lysate input. n = 3; *p < 0.05. Error bars show s.e.m

Similar articles

Cited by

References

    1. Brown GC, Neher JJ. Inflammatory neurodegeneration and mechanisms of microglial killing of neurons. Mol. Neurobiol. 2010;41:242–247. doi: 10.1007/s12035-010-8105-9. - DOI - PubMed
    1. Chen Y, Won SJ, Xu Y, Swanson RA. Targeting microglial activation in stroke therapy: pharmacological tools and gender effects. Curr. Med. Chem. 2014;21:2146–2155. doi: 10.2174/0929867321666131228203906. - DOI - PMC - PubMed
    1. An C, et al. Molecular dialogs between the ischemic brain and the peripheral immune system: dualistic roles in injury and repair. Prog. Neurobiol. 2014;115:6–24. doi: 10.1016/j.pneurobio.2013.12.002. - DOI - PMC - PubMed
    1. Loane DJ, Byrnes KR. Role of microglia in neurotrauma. Neurotherapeutics. 2010;7:366–377. doi: 10.1016/j.nurt.2010.07.002. - DOI - PMC - PubMed
    1. Longo VD, Mattson MP. Fasting: molecular mechanisms and clinical applications. Cell Metab. 2014;19:181–192. doi: 10.1016/j.cmet.2013.12.008. - DOI - PMC - PubMed

Publication types

MeSH terms