. 2017 Sep 21;7(1):12072.
doi: 10.1038/s41598-017-12229-2.

Absolute quantitation of disease protein biomarkers in a single LC-MS acquisition using apolipoprotein F as an example

Affiliations

Absolute quantitation of disease protein biomarkers in a single LC-MS acquisition using apolipoprotein F as an example

Abhinav Kumar et al. Sci Rep. .

Abstract

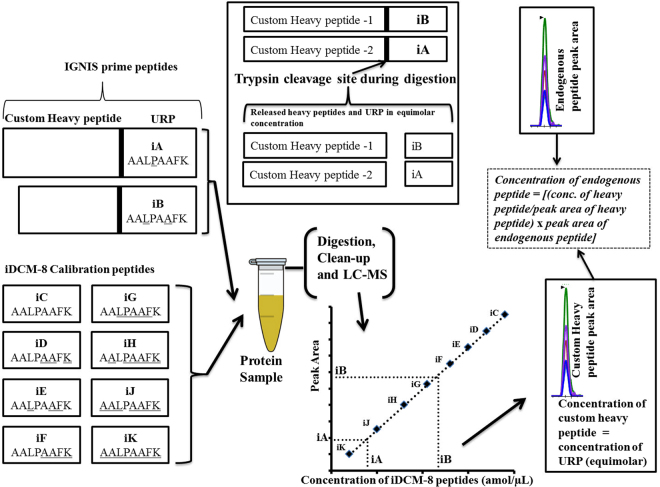
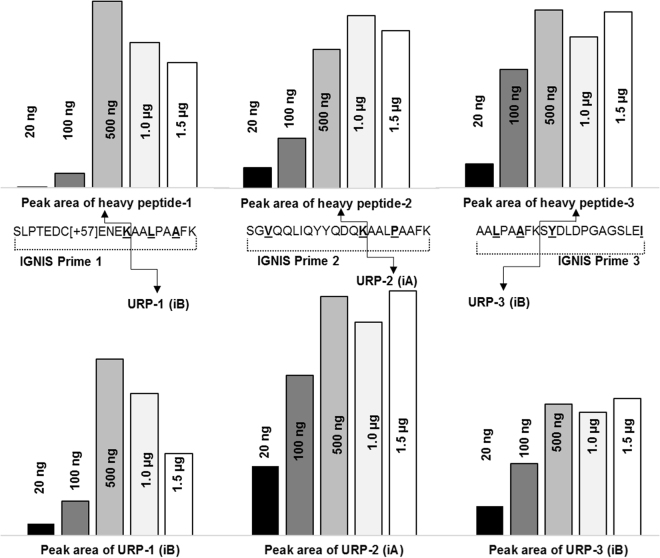
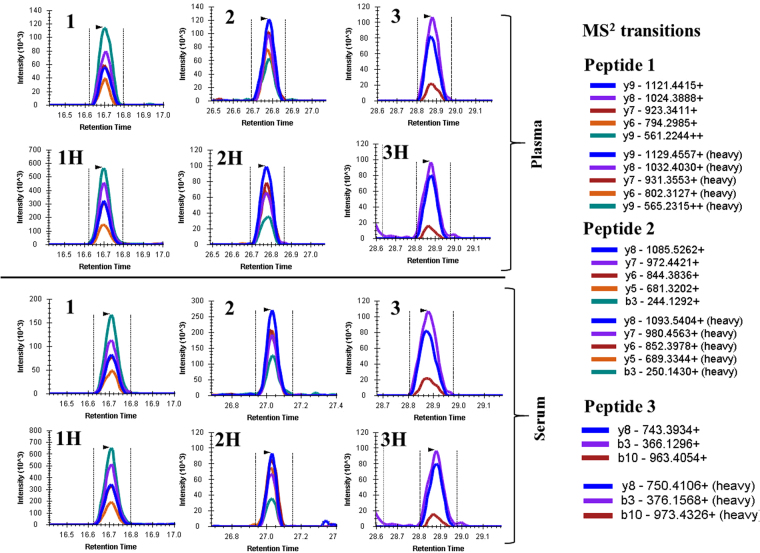
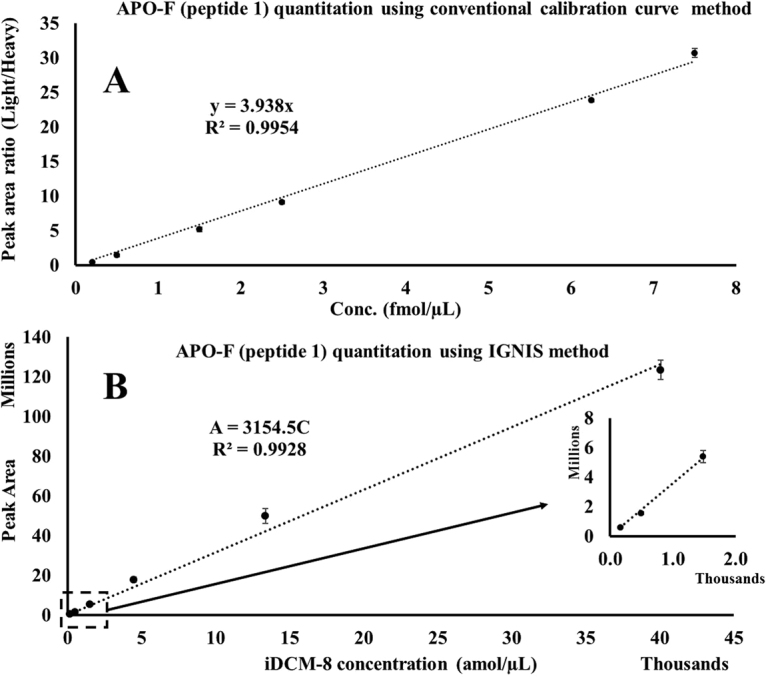
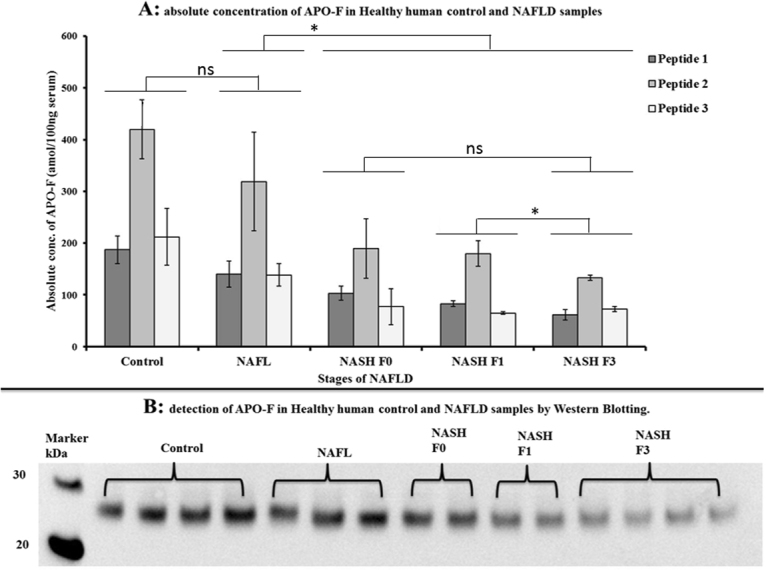
LC-MS and immunoassay can detect protein biomarkers. Immunoassays are more commonly used but can potentially be outperformed by LC-MS. These techniques have limitations including the necessity to generate separate calibration curves for each biomarker. We present a rapid mass spectrometry-based assay utilising a universal calibration curve. For the first time we analyse clinical samples using the HeavyPeptide IGNIS kit which establishes a 6-point calibration curve and determines the biomarker concentration in a single LC-MS acquisition. IGNIS was tested using apolipoprotein F (APO-F), a potential biomarker for non-alcoholic fatty liver disease (NAFLD). Human serum and IGNIS prime peptides were digested and the IGNIS assay was used to quantify APO-F in clinical samples. Digestion of IGNIS prime peptides was optimised using trypsin and SMART Digest™. IGNIS was 9 times faster than the conventional LC-MS method for determining the concentration of APO-F in serum. APO-F decreased across NAFLD stages. Inter/intra-day variation and stability post sample preparation for one of the peptides was ≤13% coefficient of variation (CV). SMART Digest™ enabled complete digestion in 30 minutes compared to 24 hours using in-solution trypsin digestion. We have optimised the IGNIS kit to quantify APO-F as a NAFLD biomarker in serum using a single LC-MS acquisition.


Conflict of interest statement

The authors declare that they have no competing interests.

Figures

Figure 1
Figure 1
The IGNIS based approach for absolute quantitation of two peptides. The iDCM-8 mixture provides a calibration curve to quantify released URP (iA and iB). IGNIS prime peptides consist of a unique reporter peptide (URP) usually with its N-terminal end attached to a lysine (K) or arginine (R) amino acid at the C-terminus of a custom heavy peptide. The custom heavy peptides and light endogenous peptides have the same peptide sequences (but with different masses), and so their retention time and MS/MS fragmentation patterns are identical. Since URP and the custom heavy peptide are in the same sequence (IGNIS prime peptides), after trypsin digestion they will both be released in equimolar concentration (box in top middle). The absolute concentration of URP can be determined using the iDCM-8 calibration curve and this concentration will be identical to that of the custom heavy peptide. The concentration of custom heavy peptide and its peak area can be used to calculate the concentration of endogenous light peptide by measuring its peak area. The custom heavy peptide and the endogenous light peptide are identical in sequence but can be differentiated by mass spectrometry due to their different mass. Underlined amino acids are isotopically heavy labelled.
Figure 2
Figure 2
The effect of trypsin amount on the digestion of IGNIS prime peptides 1, 2 and 3. The upper panel shows the peak area of released custom heavy peptides and the lower panel shows the peak area of released URPs from IGNIS prime peptides with varying amounts of trypsin during in-solution digestion. The optimum amount of trypsin for complete digestion was 500 ng for IGNIS prime 1 and 1 µg (between 500 ng to 1.5 µg) for IGNIS prime peptides 2 and 3.
Figure 3
Figure 3
Chromatograms of endogenous and spiked heavy peptides in undepleted and unfractionated human plasma and serum. The upper and lower panels show the chromatograms of peptides in plasma and serum, respectively. (1), (2) and (3) represent the chromatograms of endogenous peptide 1 (SLPTEDC[+57]ENEK), peptide 2 (SGVQQLIQYYQDQK) and peptide 3 (SYDLDPGAGSLEI), respectively. 1H, 2H and 3H represent the corresponding heavy peptides in plasma and serum to confirm the retention times of respective endogenous light peptides. MS2 transitions show the lists of y and b ions considered for measuring the peaks of each peptide. The dotp values for peptides (1), (2) and (3) were ≥ 0.95 in both plasma and serum samples.
Figure 4
Figure 4
Calibration curves for APO-F. (A) Six point calibration curve of peptide 1 in a digest of fetal calf serum (100 ng/µL). The lowest point on the calibration curve (0.2 fmol/µL) was 4 times higher than the limit of detection (LOD, 0.05 fmol/µL, see Supplementary information). A fixed amount of heavy peptide 1 (0.4 fmol/µL) was spiked into varying concentrations of light peptide 1 and the peak area ratios of light peptide 1 to heavy peptide 1 were plotted against the concentrations. Each point on the calibration curve is the average of three repeat injections with %CV varying between 0.7 to 10.9%. Two quality control (QC) samples at 0.3 fmol/µL and 3.75 fmol/µL were used to check the accuracy of quantification (see Supplementary Table 3). (B) Six point calibration curve obtained from iDCM-8 using the IGNIS approach. Only six iDCM-8 peptides (iC, iD, iE, iF, iG and iH) out of eight isotopologues were used in this calibration curve. The two isotopologues iJ and iK were not detected due to low concentration and when a high concentration of iDCM-8 was used to try and detect these isotopologues, a carryover problem for the most concentrated isotopologue, iC, was observed. An average of three repeat injections were used to plot the calibration curve (% CV = 3.9 to 11.4, Supplementary Table 4) and the absolute concentration of APO-F in three repeat injections were 148.1, 139.15 and 142.8 amol/100 ng of serum (average = 143.3 amol/100 ng, % CV = 3.11). Error bars added to each point across the calibration curve show the standard deviation.
Figure 5
Figure 5
Detection of APO-F in NAFLD clinical samples. (A) Absolute concentration of APO-F determined by the IGNIS method using serum samples from patients across different stages of NAFLD. APO-F can clearly distinguish NASH (F3/F1/F0) from healthy control and NAFL (p < 0.05, Supplementary Table 6); and between F3 and F1 stages (using peptide 2). Sample size: Control = 4, NAFL = 3, NASH F0 = 2, NASH F1 = 2, NASH F3 = 4. (B) Detection of APO-F in NAFLD samples by western blotting. *Significantly different (p < 0.05), ns - not significant (Supplementary Table 6).

References

    1. Rifai N, Ridker PM. High-sensitivity C-reactive protein: a novel and promising marker of coronary heart disease. Clin Chem. 2001;47:403–411. - PubMed
    1. Elsayed ME, Sharif MU, Stack AG. Transferrin Saturation: A Body Iron Biomarker. Adv Clin Chem. 2016;75:71–97. doi: 10.1016/bs.acc.2016.03.002. - DOI - PubMed
    1. Ramamohan V, Abbott JT, Klee GG, Yih Y. Modeling the effect of instrument drift in clinical laboratories: A serum bilirubin assay case study. IIE Transactions on Healthcare Systems Engineering. 2015;5:147–164. doi: 10.1080/19488300.2015.1060551. - DOI
    1. Mitchell BL, Yasui Y, Li CI, Fitzpatrick AL, Lampe PD. Impact of freeze-thaw cycles and storage time on plasma samples used in mass spectrometry based biomarker discovery projects. Cancer Inform. 2005;1:98–104. - PMC - PubMed
    1. Gangadharan B, et al. Discovery of novel biomarker candidates for liver fibrosis in hepatitis C patients: a preliminary study. PLoS One. 2012;7:e39603. doi: 10.1371/journal.pone.0039603. - DOI - PMC - PubMed

Publication types