. 2017 Sep 21;8(1):641.
doi: 10.1038/s41467-017-00723-0.

IgG1 memory B cells keep the memory of IgE responses

Affiliations

IgG1 memory B cells keep the memory of IgE responses

Jin-Shu He et al. Nat Commun. .

Erratum in

  • Publisher Correction: IgG1 memory B cells keep the memory of IgE responses.
    He JS, Subramaniam S, Narang V, Srinivasan K, Saunders SP, Carbajo D, Wen-Shan T, Hidayah Hamadee N, Lum J, Lee A, Chen J, Poidinger M, Zolezzi F, Lafaille JJ, Curotto de Lafaille MA. He JS, et al. Nat Commun. 2018 Mar 1;9(1):968. doi: 10.1038/s41467-018-03364-z. Nat Commun. 2018. PMID: 29497073 Free PMC article.

Abstract

The unique differentiation of IgE cells suggests unconventional mechanisms of IgE memory. IgE germinal centre cells are transient, most IgE cells are plasma cells, and high affinity IgE is produced by the switching of IgG1 cells to IgE. Here we investigate the function of subsets of IgG1 memory B cells in IgE production and find that two subsets of IgG1 memory B cells, CD80+CD73+ and CD80-CD73-, contribute distinctively to the repertoires of high affinity pathogenic IgE and low affinity non-pathogenic IgE. Furthermore, repertoire analysis indicates that high affinity IgE and IgG1 plasma cells differentiate from rare CD80+CD73+ high affinity memory clones without undergoing further mutagenesis. By identifying the cellular origin of high affinity IgE and the clonal selection of high affinity memory B cells into the plasma cell fate, our findings provide fundamental insights into the pathogenesis of allergies, and on the mechanisms of antibody production in memory B cell responses.IgE is an important mediator of protective immunity as well as allergic reaction, but how high affinity IgE antibodies are produced in memory responses is not clear. Here the authors show that IgE can be generated via class-switch recombination in IgG1 memory B cells without additional somatic hypermutation.


Conflict of interest statement

The authors declare no competing financial interests.

Figures

Fig. 1
Fig. 1
Diversity of IgG1 memory B cells (MBC) in type 2 responses. a, b IgG1+ MBC subsets in spleen and mesenteric LN (mLN) of TBmc mice immunised with OVA-PEP1 (OVA-PEP1 immunisation), and of BALB/c mice infected with Nippostrongylus brasiliensis (N.brasiliensis infection) at 10 weeks after treatment. The samples in each group were pooled, pre-enriched by depletion of IgD+, CD138+ and CD3+ cells. a Frequency of GL7+ germinal centre (GC) cells and PDL2+ MBC among gated IgG1+ B220+ cells (left), and identification of CD73+CD80+ (DP), CD73CD80+ (SP) and CD73CD80 (DN) IgG1 MBC subsets (right). b Frequency of CD73+CD80+ (DP), CD73CD80+ (SP), CD73CD80 (DN) and CD73+CD80 cells among gated PDL2+IgG1+ MBC from OVA-PEP1 immunised TBmc mice (top) or N.brasiliensis infected BALB/c mice (bottom). Data are mean ± SEM of 5 OVA-PEP1 immunisation experiments and six N.brasiliensis infection experiments
Fig. 2
Fig. 2
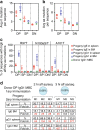
CD73+CD80+ IgG1 MBC give rise to high-affinity IgE. a Diagram of adoptive transfer experiments to evaluate IgE production from IgG1 MBC subsets (i.v.: intravenously). b Donor-derived IgEa and IgG1a production in CB17 IgHb recipient mice transferred with IgG1+ MBC (DP, SP and DN) and CD4 memory T cells (T) from N.brasiliensis (N.b.) infected mice, and subsequently infected with N.b. IgEa and IgG1a serum levels were determined at 2 weeks after transfer and infection. The data shows average of n = 8 for DP + T, n = 3 for SP + T, n = 3 for DN + T, or n = 7 for T alone, n = 7 for N.b. and n = 7 for untreated (UT) groups. The samples were pooled from three independent experiments. Statistical analysis was performed using Mann–Whitney–Wilcoxon U-test. *P < 0.05, **P < 0.01; n.s., not significant (P > 0.05). c, d Kinetics of the production of total and PEP1-specific IgE c and IgG1 d in serum of Rag1 KO mice that were transferred with IgG1 MBC (DP, SP and DN) and CD4 memory T cells (T) from OVA-PEP1 immunised TBmc mice, and were subsequently immunised with OVA-PEP1. The data for each time point was obtained with pooled serum from 4 (DP and SP) and 3 (DN) recipient mice per group. The serum was diluted 500-fold to measure PEP1-specific IgG1, and 100-fold to measure PEP1-specific IgE. Non-parametric Kruskal–Wallis rank-sum test was used to calculate P value. *P < 0.05; n.s., not significant (P > 0.05). The data are representative of three independent experiments
Fig. 3
Fig. 3
PC derived from DP IgG1 MBC are enriched in high affinity mutations. VDJ nucleotide (nt) and amino acid (aa) sequences were compared between IgG1 MBC subsets and their IgE and IgG1 progeny cells. IgG1 MBC subsets were purified from 10 weeks OVA-PEP1 immunised TBmc mice, and transferred together with CD4 memory T cells into Rag1 KO recipient mice. The recipient mice were immunised with OVA-PEP1. Spleen and bone marrow (BM) of the recipient mice were collected 2 weeks later. The VDJ repertoires of parental IgG1 MBC subsets and their IgG1 and IgE progeny were analysed using next generation sequencing. a, b Average number of nt a and aa b mutations per sequence. c Percentage of sequences containing R97T, N100aS/T or A101T high affinity CDR3 mutations. ac Data are average ± SEM of three mice per group. d Enrichment in the percentage of CDR3 sequences containing 2 or 3 high affinity aa per sequence (hi aff aa/seq) in the IgE and IgG1 progeny of DP IgG1 MBC (M1, M2 and M3 indicate three recipient mice). Data are representative of two independent experiments
Fig. 4
Fig. 4
High affinity PC are selected from pre-existent memory clones. The repertoires of VDJ sequences from donor IgG1 MBC subsets (from 10 weeks OVA-PEP1 immunised TBmc mice) and their IgG1 and IgE progenies in spleen and BM of recipient mice (2 weeks after transfer/immunisation), were used to investigate the precursor-progeny relationship. a In silico derived sublibrary of the top 20 (frequency descending) VDJ CDR3 aa sequences containing high affinity mutations (in red). b Radar charts show the presence and frequency of each of the top 20 high affinity CDR3 sequences in donor DP IgG1 MBC and in the progeny IgE (left) and IgG1 (right) libraries. a, b The data are from one representative mouse of three recipient mice. c Percentage of the progeny IgE and IgG1 nucleotide sequences (nt seq) encoding high affinity CDR3 that were found in the donor DP IgG1 MBC. M1– M3 indicate individual recipient mice
Fig. 5
Fig. 5
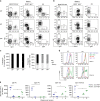
Early and late generation of IgE PC from different IgG1 MBC subsets. The phenotype of IgG1 and IgE cells generated from IgG1 MBC was analysed. IgG1 MBC subsets isolated from OVA-PEP1 immunised TBmc mice, were transferred together with CD4 memory T cells into Rag1 KO recipients. The recipient mice were immunised with OVA-PEP1. One and 6 weeks later spleen cells were collected, stained with antibodies to B220, CD138, GL7, PDL2, IgE, IgG1 and the proliferation antigen Ki67, and analysed by flow cytometry. a, b Left: frequency of IgE+B220+ and IgG1+B220+ cells among total B220+CD138 cells; middle: frequency of GL7+ GC cells and PDL2+ memory B cells among B220+CD138IgG1+ cells; right: frequency of IgE+ PC and IgG1+ PC among B220CD138+ PC. c Percentage of PC, GC cells and memory B cells among total IgE+ cells (left) and total IgG1+ cells (right) at 1 week after transfer/immunisation. d Proliferation analysis of splenic IgE+ and IgG1+ cells of recipient mice at weeks 1 and 6 after transfer/immunisation. e Number of IgE+ PC, IgG1+ PC, IgG1+ GC and IgG1+ MBC per spleen in recipient mice at weeks 1 and 6 after transfer/immunisation. Each dot represents one recipient mouse. Average of 4 (DP + T, week 1), 5 (DP + T, week 6), 3 (DN + T, week 1) and 3 (DN + T, week 6) mice per group were shown. Statistical analysis was performed using Mann–Whitney–Wilcoxon U-test. *P < 0.05. The data are representative of three independent experiments
Fig. 6
Fig. 6
Transcriptional profile suggests readiness for activation of DP IgG1 MBC. a Inter-sample similarity between DP, SP and DN IgG1 MBC, IgG1 GC cells and naive B cells, visualised as a multidimensional scaling (MDS) plot. b Connectivity map (CMap) analysis to test the similarity of the transcriptional profile of sorted IgG1 MBC, IgG1 GC and naive B cells, with B cells activated with LPS or LPS + CD40 (GSE35998 data set). ae The B cell populations were sorted from pooled spleen and mLN of 3 BALB/c mice at 10 weeks after infection with N.b. ce Heatmaps derived from the RNA-seq analysis showed the clustering of DEG related to c transcriptional regulation, d cellular receptors and e kinases, among IgG1 MBC subsets (DP, SP and DN) and naive B cell samples
Fig. 7
Fig. 7
IgE derived from DP MBC mediates anaphylaxis. The pathogenic capacity of IgE derived from DP and DN IgG1 MBC was evaluated in a passive cutaneous anaphylaxis (PCA) assay. IgG-depleted serum was obtained from Rag1 KO recipient mice that had been transfused with DP or DN IgG1+ MBC and CD4 memory T cells from primary OVA-PEP1 immunised TBmc mice as described in Fig. 2a, c, d. The recipient mice were immunised with OVA-PEP1, and serum was obtained at 1 and 6 weeks after transfer/immunisation. Serum from each group was pooled and depleted of IgG antibodies. For the PCA assay, 20 μl of serum was injected intradermally into the ears of naive BALB/c mice. Twenty-four hours later, 50 µg OVA-PEP1 and 1% Evans Blue in PBS were injected intravenously. Thirty minutes later, the anaphylactic reaction was evaluated visually. a, b Sera from recipients of DP IgG1 MBC (DP-serum), but not from recipients of DN IgG1 MBC (DN-serum), mediated anaphylaxis. a One-week sera. b Six-week sera. c To determine if the DN-serum could inhibit anaphylaxis, 6-week DP-serum was diluted with 6-week DN-serum, or with serum from untreated Rag1 KO mice (RKO serum) at the indicated DP:DN and DP:RKO ratios (1:125; 1:250; 1:500). The mixed serum anaphylactic activity was measured in a PCA assay. The data are representative of two experiments

References

    1. Vieira P, Rajewsky K. The half-lives of serum immunoglobulins in adult mice. Eur. J. Immunol. 1988;18:313–316. doi: 10.1002/eji.1830180221. - DOI - PubMed
    1. Yang Z, Sullivan BM, Allen CD. Fluorescent in vivo detection reveals that IgE(+) B cells are restrained by an intrinsic cell fate predisposition. Immunity. 2012;36:857–872. doi: 10.1016/j.immuni.2012.02.009. - DOI - PubMed
    1. He JS, et al. The distinctive germinal center phase of IgE+B lymphocytes limits their contribution to the classical memory response. J. Exp. Med. 2013;210:2755–2771. doi: 10.1084/jem.20131539. - DOI - PMC - PubMed
    1. He JS, et al. Biology of IgE production: IgE cell differentiation and the memory of IgE responses. Curr. Top Microbiol. Immunol. 2015;388:1–19. - PubMed
    1. Xiong H, Dolpady J, Wabl M, Curotto de Lafaille MA, Lafaille JJ. Sequential class switching is required for the generation of high affinity IgE antibodies. J. Exp. Med. 2012;209:353–364. doi: 10.1084/jem.20111941. - DOI - PMC - PubMed

Publication types

MeSH terms