. 2017 Sep 21;7(1):12078.
doi: 10.1038/s41598-017-12171-3.

Differential regulation of Effector and Regulatory T cell function by Blimp1

Affiliations

Differential regulation of Effector and Regulatory T cell function by Blimp1

Rashmi Bankoti et al. Sci Rep. .

Abstract

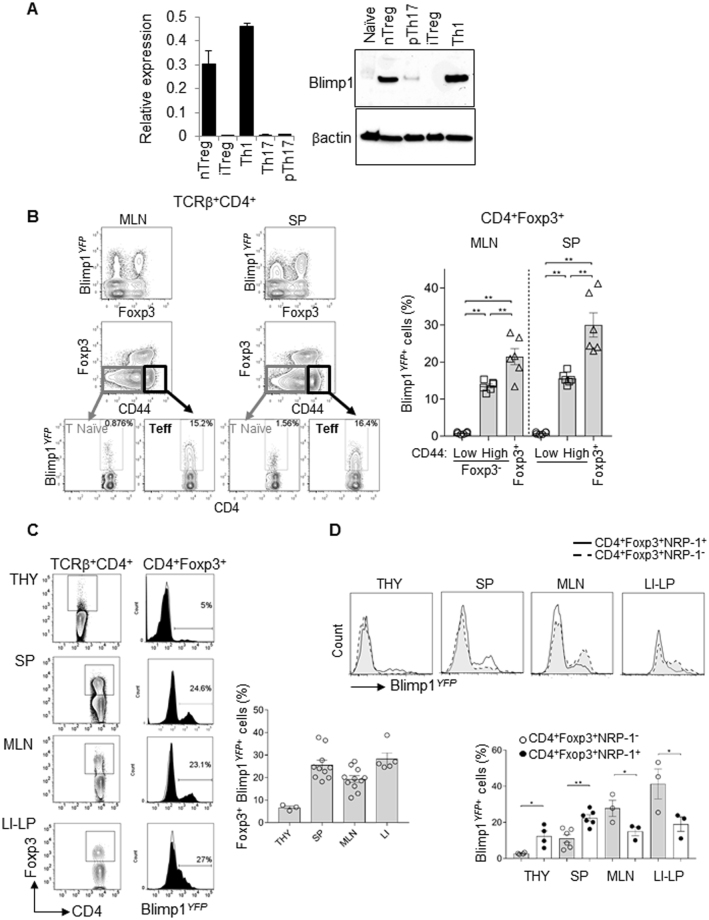
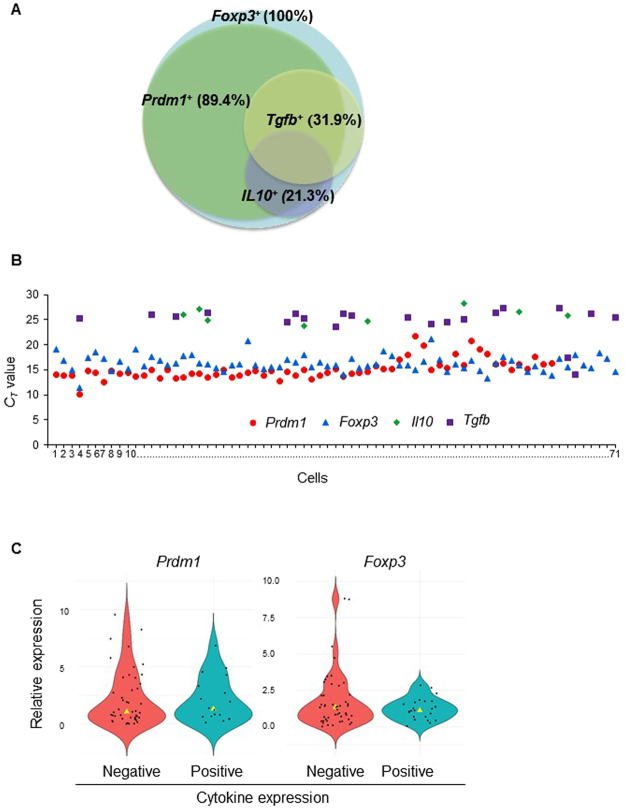
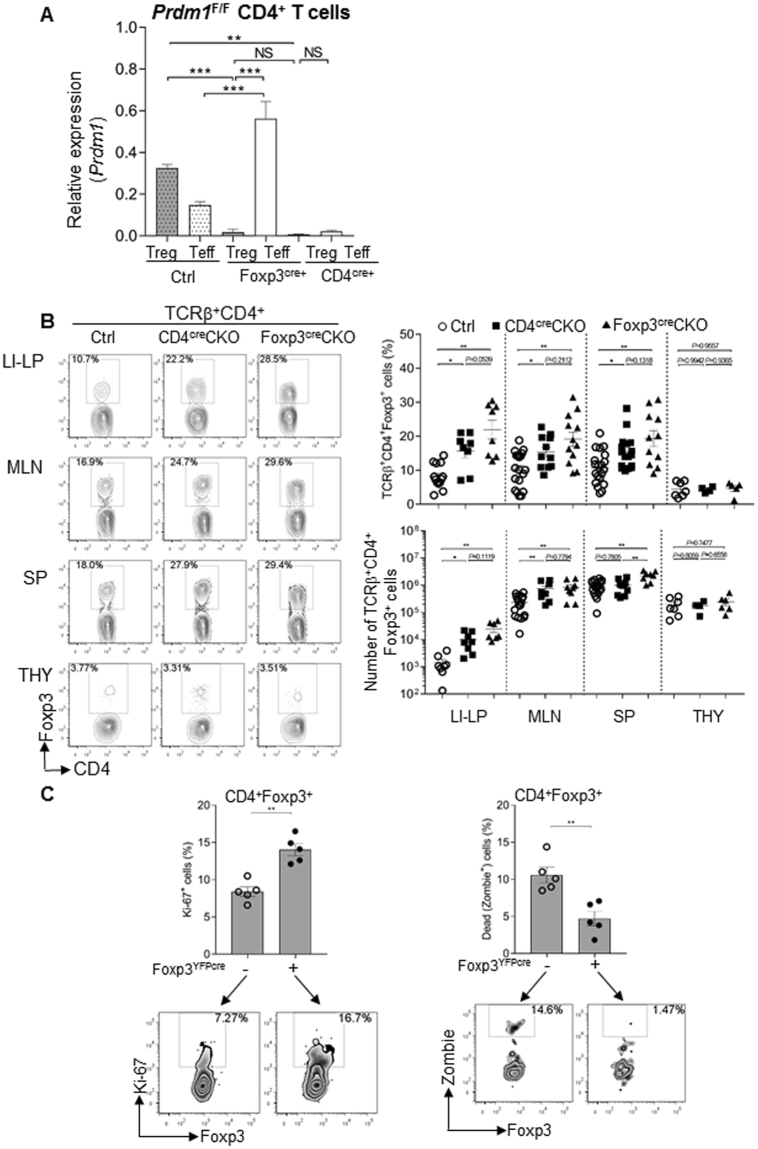
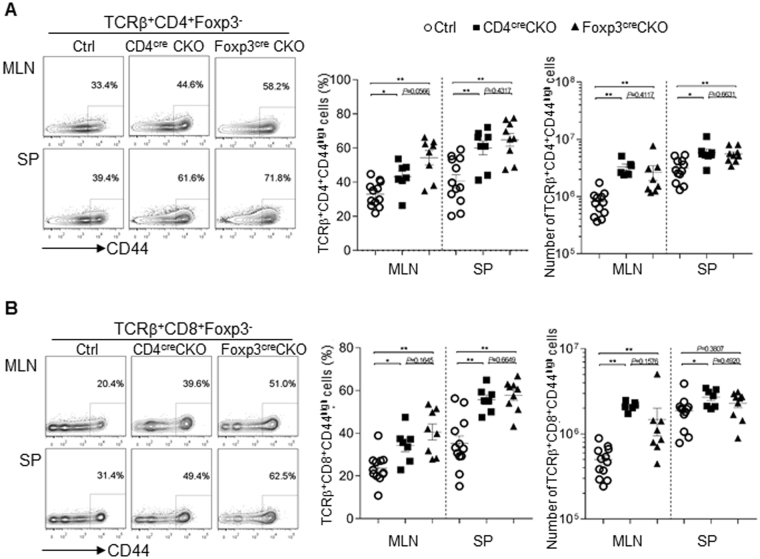
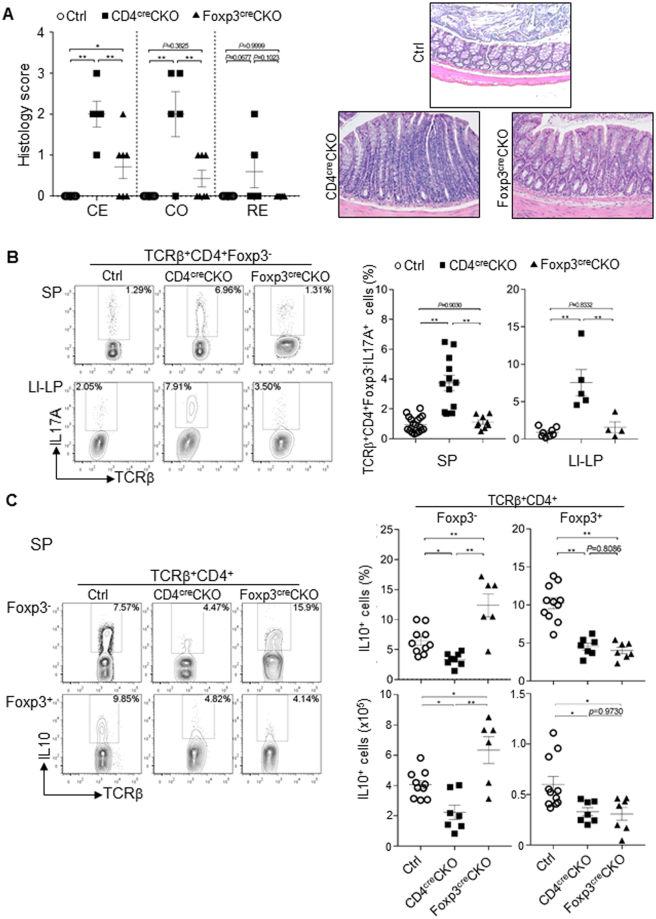
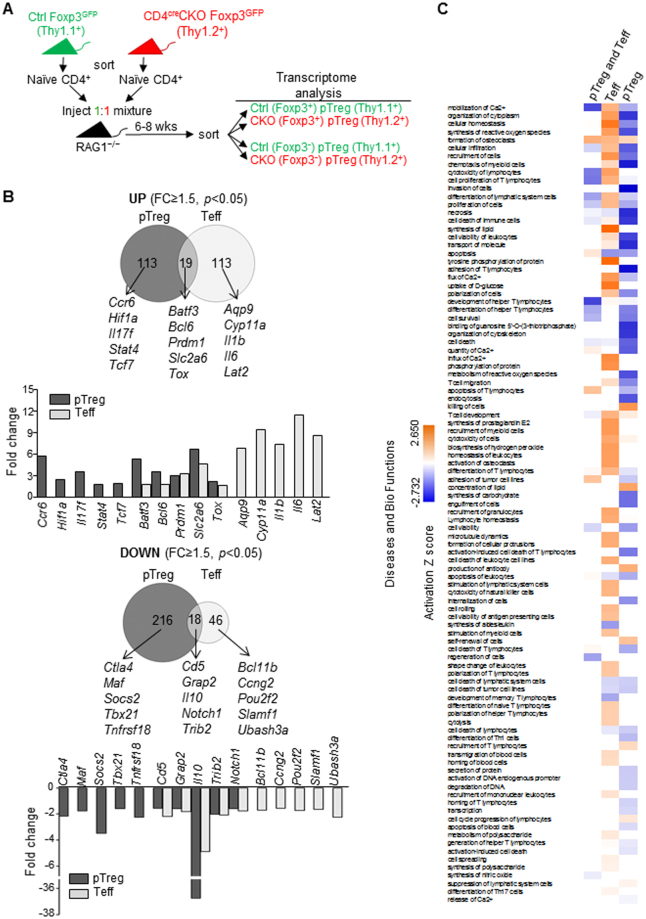
The transcriptional regulator Blimp1 plays crucial roles in controlling terminal differentiation in several lineages. In T cells, Blimp1 is expressed in both effector (Teff) and regulatory (Treg) cells, and mice with T cell-specific deletion of Blimp1 (Blimp1CKO mice) spontaneously develop severe intestinal inflammation, indicating a crucial role for Blimp1 in T cell homeostasis regulation. Blimp1 has been shown to function as a direct activator of the Il10 gene and although its requirement for IL10 expression has been demonstrated in both Treg and Teff cells under inflammatory conditions, the intrinsic requirement of Blimp1 for homeostatic maintenance of these T cell subsets had not been investigated. Using mice with Foxp3+ Treg-cell specific deletion of Blimp1 and other approaches, here we show that Foxp3+ Treg cell-intrinsic expression of Blimp1 is required to control Treg and Teff cells homeostasis but, unexpectedly, it is dispensable to prevent development of severe spontaneous intestinal inflammation. In addition, we show that Blimp1 controls common and unique aspects of Treg and Teff cell function by differentially regulating gene expression in these T cell subsets. These findings document previously unappreciated aspects of Blimp1's role in T cell biology and shed light on the intricate mechanisms regulating Treg and Teff cell function.


Conflict of interest statement

The authors declare that they have no competing interests.

Figures

Figure 1
Figure 1
Blimp1 expression in CD4+ effector and Foxp3+ Treg cells under homeostatic conditions. (A) Quantitative Real time-PCR (qRT-PCR) analysis Prdm1 (Blimp1) mRNA (relative to β2-microglobulin) (left) and Western blotting (right) of CD4+ Foxp3GFP+ Treg (nTreg) sorted from Ctrl Foxp3GFP mice or in vitro differentiated Treg (iTreg,), Th1, Th17 or pathogenic (p) Th17 cells differentiated from naïve cells from the same mice (C57BL/6). (N = 3 mice/group, qPCR and N = 2 mice/sample, Western blotting). (B) FACS plot shows Prdm1 mRNA expression (as reported by YFP, Blimp1YFP) among peripheral Treg (Foxp3+ as determined by intracellular staining of Foxp3 protein), effector (Foxp3 CD44high) and naïve (Foxp3 CD44low) TCRβ+ CD4+ cells in mesenteric lymph nodes (MLN, left) and spleen (SP, right). Bar graph shows the average percentage of Blimp1YFP+ cells among TCRβ+ CD4+ Foxp3+, TCRβ+ CD4+ Foxp3 CD44high or TCRβ+ CD4+ Foxp3 CD44low cells. (C) FACS plots and histograms overlay show percent of Blimp1YFP+ cells in gated TCRβ+ CD4+ Foxp3+ cells from thymus (THY), spleen (SP), mesenteric lymph nodes (MLN) and large (LI) intestines lamina propria (LP) from control (open histogram) and Blimp1YFP (filled histogram) mice. Gating of Foxp3+ cells (as determined by intracellular staining of Foxp3 protein) is shown in FACS plots on the left. Cumulative data from several mice is shown on graph (right). (D) FACS histograms show analysis of Blimp1YFP expression in gated TCRβ+ CD4+ Foxp3+ Neuropilin-1 (Nrp-1)+ (full line, empty histograms) and TCRβ+ CD4+ Foxp3+ Nrp-1 (dashed line, filled histograms) cells in THY, SP, MLN and LI-LP from Blimp1YFP mice. Lower panel shows percent of Blimp1YFP+ cells in CD4+ Foxp3+ Nrp-1+ (filled circles) and CD4+ Foxp3+ Nrp-1 (open circles) cells iin different organs. For all graphs, each symbol represents one mouse. (N = 2–11 mice/group). *P < 0.05 and **P < 0.01, one-way ANOVA (B) and paired t- test (C). Error bars indicate SEM.
Figure 2
Figure 2
Single cell qRT-PCR analysis of Prdm1 (Blimp1) expression in Treg cells. (A) Venn diagram showing frequency of Foxp3, Prdm1, Il10 and Tgfb-expressing cells in all analyzed CD4+ CD25high T cells single cells. (B) C t values of Foxp3, Prdm1, Tgfb and Il10 in all CD4+ CD25high T cells analyzed. Each symbol represents one cell. (C) Violin plots showing relative expression of Prdm1 (left) and Foxp3 (right) in cells that expressed (positive) or lacked (negative) cytokines (Tgfb and or Il10) expression. Each circle indicates one cell. Yellow triangles indicate median.
Figure 3
Figure 3
Increased Treg numbers in Blimp1 CKO mice is a cell-intrinsic effect associated with increased proliferation and decreased cell death. (A) Expression of Prdm1 (Blimp) mRNA, (qRT-PCR, relative to β2Microglobulin) in sorted Treg (CD4+ Foxp3GFP+) and Teff (CD4+ Foxp3 CD44high) cells from control (Prdm1 F/F), Foxp3CRE CKO (Prdm1 F/F Foxp3cre+), and CD4CRE CKO (Prdm1 F/F CD4CRE+) mice (B) Left panel; representative FACS plots of TCRβ+ CD4+ Foxp3+ cells (as determined by intracellular staining of Foxp3 protein) in large intestine lamina propria (LI-LP), mesenteric lymph nodes (MLN), spleen (SP) and thymus (THY) from control (Ctrl) or Blimp1 CKO (CD4creCKO or Foxp3creCKO) mice. Right graphs; percentage of Foxp3+ cells among TCRβ+ CD4+ cells (top) and absolute numbers of Foxp3+ cells (bottom) in LI-LP, MLN, SP and THY. Each symbol represents one mouse (N ≥ 4mice/group). Bars indicate average ± SEM. *P < 0.05, **P < 0.01, one-way ANOVA. (C) Top: graphs showing the average percentage ± SEM of Ki-67+ or Zombie (fixable viability dye)+ cells among CD4+ Foxp3+ (as determined by intracellular staining of Foxp3 protein) Foxp3YFP-cre+ or CD4+ Foxp3+ Foxp3YFP-cre- cells from Foxp3creCKO female mice. Each circle represents one mouse. Bottom: representative FACS plots showing analysis of Ki-67+ or Zombie+ cells (N = 5 mice). **P < 0.01, paired t -test. In (A) results representative of two different experiments; In (B) cell numbers were calculated based on the total number of cells obtained from each organ and population frequency determined by FACS analysis.
Figure 4
Figure 4
Treg-cell specific deletion of Blimp1 leads to Teff cells accumulation. (A) Representative FACS plots (left) show CD4+ (TCRβ+ CD4+ Foxp3 CD44high) Teff cells in mesenteric lymphnodes (MLN) and spleen (SP) from control (Ctrl) or Blimp1 CKO (CD4creCKO or Foxp3creCKO) mice. Graphs show percentage (middle) and absolute number (right) of TCRβ+ CD4+ Foxp3 CD44high cells. (B) Representative FACS plots (left) of T effector CD8+ (TCRβ+ CD8+ Foxp3 CD44high) cells in -MLN and SP from Ctrl, CD4creCKO or Foxp3creCKO mice. Graphs show percentage (middle) and absolute number (right, calculated as described on Fig. 3 legend) of TCRβ+ CD8+ Foxp3 CD44high cells. Each symbol represents one mouse (N ≥ 6 mice/group). Bars indicate average ± SEM. *P < 0.05, **P < 0.01, one-way ANOVA.
Figure 5
Figure 5
Treg-cell intrinsic deletion of Blimp1 leads to mild intestinal inflammation. (A) Left: scatter plots showing histology score of cecum (CE), colon (CO) and rectum (RE) among control (Ctrl), CD4creCKO and Foxp3creCKO mice. Each symbol represents one mouse (N ≥ 5 mice/group, Bars indicate average ± SEM. *P < 0.05, **P < 0.01, one-way ANOVA. Right: representative pictures (20X magnification) of histological sections of colon of mice in each group. (B) Representative FACS plots (left) and scatter plots (right) showing the frequency of IL17A expression in TCRβ+ CD4+ Foxp3 cells in spleen (SP) and large intestine lamina propria (LI-LP) from Ctrl, CD4creCKO or Foxp3creCKO mice after stimulation. Right scatter plots: Each symbol represents one mouse (N ≥ 4 mice/group). Bars indicate average ± SEM. **P < 0.01, one-way ANOVA. (C) Representative FACS plots (left) and Scatter plots showing the frequency (right, top) or the total numbers (right, bottom) of IL10-producing cells in TCRβ+ CD4+ Foxp3 or TCRβ+ CD4+ Foxp3+ cells in the SP from Ctrl, CD4creCKO or Foxp3creCKO mice. Each symbol represents one mouse (N ≤ 6 mice/group). Bars indicate average ± SEM. *P < 0.05, **P < 0.01, one-way ANOVA.
Figure 6
Figure 6
Blimp1 regulates unique and commonly shared genetic programs in CD4+ Treg and Teff cells. (A) Schematic representation of experimental approach used to obtain allotype-marked Blimp1-sufficient (Ctrl, Thy1.1+) and deficient (CKO, Thy1.2+) Teff (CD4+ Foxp3) and Treg (CD4+ Foxp3+) cells differentiated in the same environment in vivo. (B) Venn diagrams representing the number of deferentially expressed (DE) genes upregulated (top) and downregulated (bottom) in pTreg and Teff cells (CD4creCKO versus Ctrl) generated from Ctrl and CD4creCKO CD4+ naive T cells co-injected into RAG1−/− mice and used for mRNA microarray analysis. Three biological replicates were used for each sample. Bar graphs under Venn diagram show fold change for selected genes in each group. (C) IPA analysis of DE genes (1.5-fold at P < 0.05): shown are comparison analysis of diseases and bio functions between common DE genes in both Foxp3GFP+pTreg (pTreg) and Foxp3GFP CD44high (CD4+ Teff) cells, DE genes in CD4+ Teff cells only and in pTreg cells only (−log10 p value cut-off; 1.3).

References

    1. Martins G, Calame K. Regulation and functions of Blimp-1 in T and B lymphocytes. Annu Rev Immunol. 2008;26:133–169. doi: 10.1146/annurev.immunol.26.021607.090241. - DOI - PubMed
    1. Linterman MA, et al. Foxp3 + follicular regulatory T cells control the germinal center response. Nature medicine. 2011;17:975–982. doi: 10.1038/nm.2425. - DOI - PMC - PubMed
    1. Cretney, E. et al. The transcription factors Blimp-1 and IRF4 jointly control the differentiation and function of effector regulatory T cells. Nat Immunol 12, 304-311. - PubMed
    1. Minnich M, et al. Multifunctional role of the transcription factor Blimp-1 in coordinating plasma cell differentiation. Nat Immunol. 2016;17:331–343. doi: 10.1038/ni.3349. - DOI - PMC - PubMed
    1. Johnston RJ, et al. Bcl6 and Blimp-1 are reciprocal and antagonistic regulators of T follicular helper cell differentiation. Science. 2009;325:1006–1010. doi: 10.1126/science.1175870. - DOI - PMC - PubMed

Publication types

MeSH terms

Substances