. 2017 Sep 7:8:1097.
doi: 10.3389/fimmu.2017.01097. eCollection 2017.

Regulation of Human Macrophage M1-M2 Polarization Balance by Hypoxia and the Triggering Receptor Expressed on Myeloid Cells-1

Affiliations

Regulation of Human Macrophage M1-M2 Polarization Balance by Hypoxia and the Triggering Receptor Expressed on Myeloid Cells-1

Federica Raggi et al. Front Immunol. .

Abstract

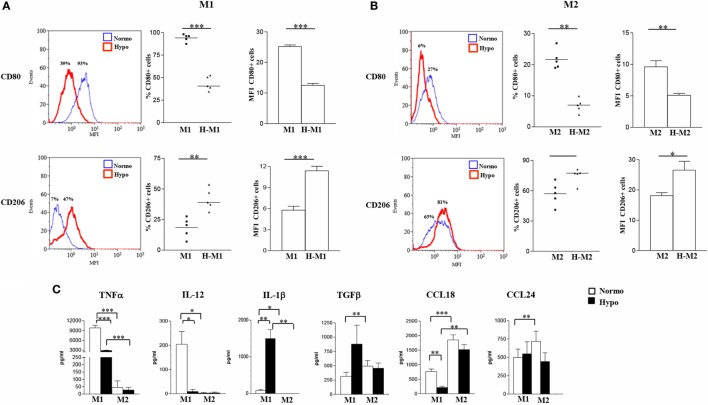
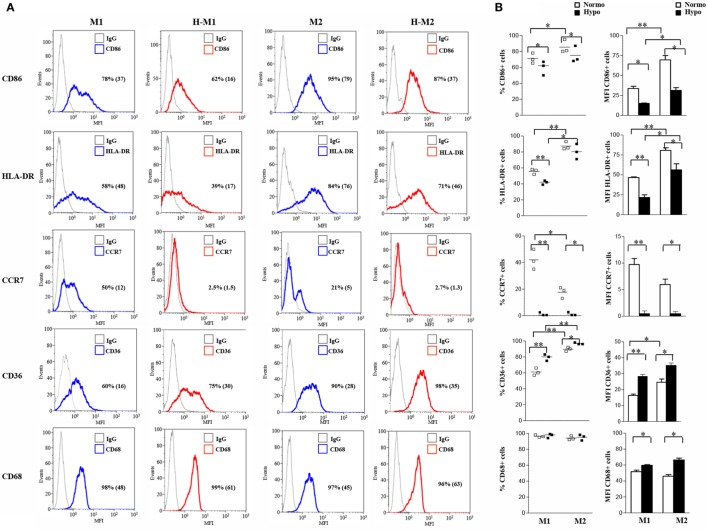
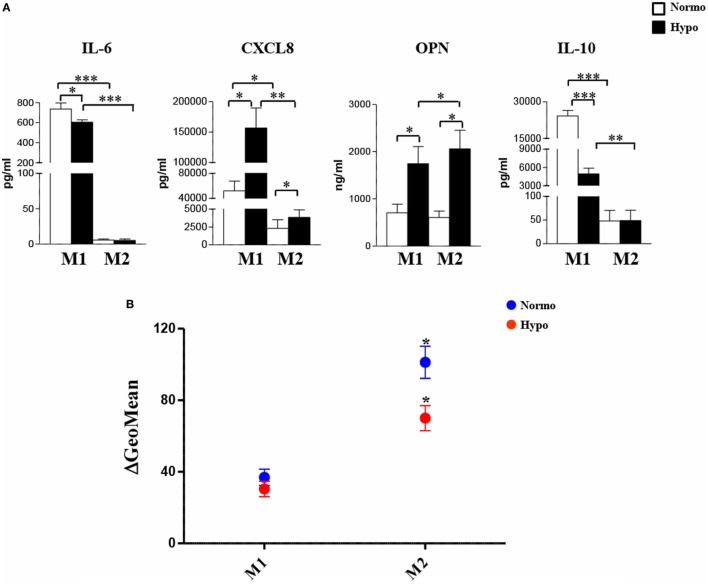
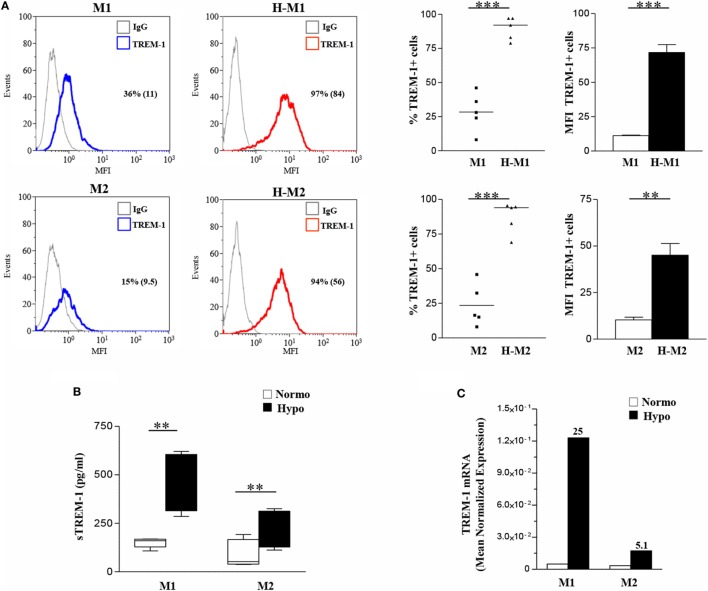
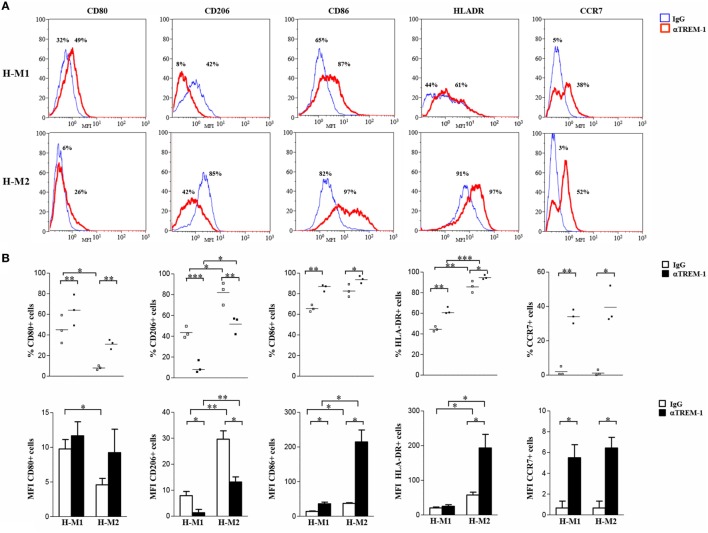
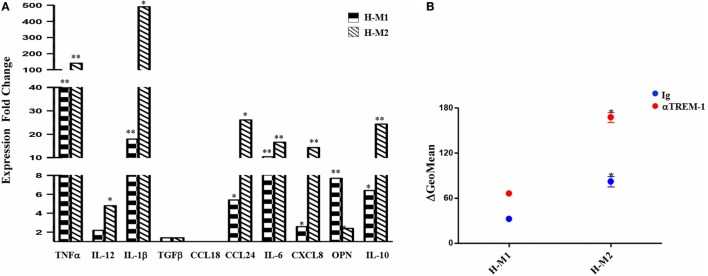
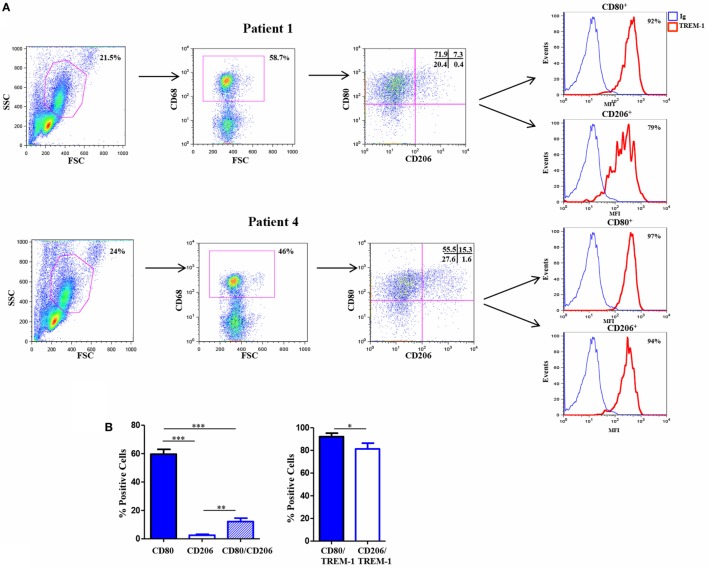
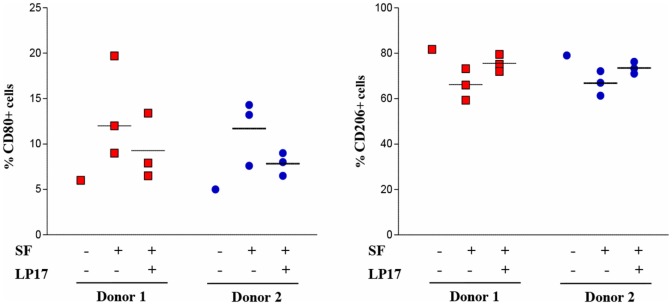
Macrophages (Mf) are a heterogeneous population of tissue-resident professional phagocytes and a major component of the leukocyte infiltrate at sites of inflammation, infection, and tumor growth. They can undergo diverse forms of activation in response to environmental factors, polarizing into specialized functional subsets. A common hallmark of the pathologic environment is represented by hypoxia. The impact of hypoxia on human Mf polarization has not been fully established. The objective of this study was to elucidate the effects of a hypoxic environment reflecting that occurring in vivo in diseased tissues on the ability of human Mf to polarize into classically activated (proinflammatory M1) and alternatively activated (anti-inflammatory M2) subsets. We present data showing that hypoxia hinders Mf polarization toward the M1 phenotype by decreasing the expression of T cell costimulatory molecules and chemokine homing receptors and the production of proinflammatory, Th1-priming cytokines typical of classical activation, while promoting their acquisition of phenotypic and secretory features of alternative activation. Furthermore, we identify the triggering receptor expressed on myeloid cells (TREM)-1, a member of the Ig-like immunoregulatory receptor family, as a hypoxia-inducible gene in Mf and demonstrate that its engagement by an agonist Ab reverses the M2-polarizing effect of hypoxia imparting a M1-skewed phenotype to Mf. Finally, we provide evidence that Mf infiltrating the inflamed hypoxic joints of children affected by oligoarticular juvenile idiopatic arthritis express high surface levels of TREM-1 associated with predominant M1 polarization and suggest the potential of this molecule in driving M1 proinflammatory reprogramming in the hypoxic synovial environment.

Keywords: hypoxia; immunoregulatory receptors; inflammation; macrophages; polarization.


Figures

Figure 1
Figure 1
Effects of hypoxia on M1 and M2 polarization markers. M1- and M2-polarized Mf were generated from M-CSF-treated primary Mn stimulated with LPS and IL-4, respectively, under normoxic or hypoxic condition. (A,B) Surface marker expression. CD80 and CD206 surface levels were compared by flow cytometry. Histograms depict the results obtained in one representative donor; the blue lines represent the fluorescent profile of normoxic cells, and the red lines represent the fluorescent profile of hypoxic cells stained with the indicated Abs; the percentage of positive cells is indicated. The scatter plots represent the percentage of positive cells from five different donors (dots) with horizontal lines indicating mean values for each group. The bar graphs represent the means of mean fluorescence intensity (MFI) ± SEM of positive cells in five different donors. p values of M1 relative to H-M1, M2 relative to H-M2: *p < 0.05; **p < 0.01; ***p < 0.001. (C) Cytokine/chemokine secretion. The concentration of the indicated cytokines/chemokines was measured by specific ELISA in the supernatants from normoxic (open bars) and hypoxic (full bars) M1 and M2 cells. Results are expressed as pg/8 × 105 cells/mL and represent the mean ± SEM of five different experiments. p values of M1 relative to M2, M1 relative to H-M1, M2 relative to H-M2, H-M1 relative to H-M2: *p < 0.05; **p < 0.01; ***p < 0.001.
Figure 2
Figure 2
Differential regulation by hypoxia of phenotypic marker expression in M1/M2-polarized Mf. M1/M2 and H-M1/H-M2 cells were generated as described in the legend of Figure 1. Cells were stained with PE-conjugated Abs to CD86, CCR7, HLA-DR, CD36, and CD68 or isotype-matched controls and analyzed by flow cytometry. Results are expressed as detailed in the legend of Figures 1A,B. (A) Histograms depict the results obtained in one of three independent donors; positive cell percentage and mean fluorescence intensity (MFI) (between brackets) are indicated. (B) The scatter plots represent the percentage of positive cells from three different donors (dots) with horizontal lines indicating mean values for each group. The bar graphs represent the means of MFI ± SEM of positive cells in three different donors. p values of M1 relative to M2, M1 relative to H-M1, M2 relative to H-M2, H-M1 relative to H-M2: *p < 0.05; **p < 0.01.
Figure 3
Figure 3
Modulation by hypoxia of cytokine/chemokine secretion and endocytic activity in M1/M2-polarized Mf. M1/M2 and H-M1/H-M2 cells were generated as described in the legend of Figure 2. (A) Cytokine/chemokine secretion. Cell-free supernatants were harvested from M1/M2 (open bars) and H-M1/H-M2 (full bars) cultures and assayed for the indicated cytokine/chemokine content by ELISA. Results are expressed as pg/8 × 105 cells/mL (IL-6, CXCL8, IL-10) or ng/8 × 105 cells/mL (OPN) and represent the mean ± SEM of five different experiments p value: *p ≤ 0.05; **p ≤ 0.01; ***p < 0.001. (B) Endocytic activity. M1/M2 and H-M1/H-M2 cells were incubated for 60 min with FITC-dextran at 4 and 37°C under normoxic and hypoxic conditions, and dextran uptake was determined by flow cytometry. Results are expressed as geometric mean fluorescence intensity (MFI) of cells taking up dextran at 37°C subtracted from that of cells incubated at 4°C (ΔGeoMean). The mean ± SEM of three independent experiments is shown. p values of M1 relative to M2 and H-M1 relative to H-M2: *p ≤ 0.05.
Figure 4
Figure 4
TREM-1 upregulation in H-M1- and H-M2-polarized Mf. M1/M2 and H-M1/H-M2 cells were generated as described in the legend of Figure 2. (A) TREM-1 surface expression. Cells were stained with PE-conjugated TREM-1 Ab, and TREM-1 membrane expression was assessed by flow cytometry. Results are expressed as in the legend of Figure 2. Histograms depict the results obtained from one representative experiments of five performed; positive cell percentage and mean fluorescence intensity (MFI) (between brackets) are indicated. Scatter plots represent the percentage of TREM-1-expressing cells from five different donors (dots), with horizontal line representing mean values for each group. The bar graphs represent the MFI ± SEM of TREM-1+ cells in five different donors. p values of M1 relative to H-M1, M2 relative to H-M2: **p < 0.01; ***p < 0.001. (B) sTREM-1 secretion. sTREM-1 concentration in cell-free supernatants was measured by ELISA in the same preparations analyzed in panel A. Results are shown as a box plot and expressed as pg/8 × 105 cells/mL. Boxes contain the values falling between the 25th and 75th percentiles, horizontal lines represent mean values, and whiskers (lines that extend from the boxes) represent the highest and lowest values for each group. p values of M1 relative to H-M1 and M2 relative to H-M2: **p < 0.01. (C) TREM-1 mRNA expression. TREM-1 transcript levels were quantified by qRT-PCR in total RNA. Data are expressed as mean normalized expression, calculated on the basis of triplicate measurements for each experiment/donor, relative to the values obtained in parallel for three reference genes. Results from a representative of five tested donors are shown. Fold increase values in hypoxic versus normoxic (considered as equal to 1) cells are indicated by a number associated with each bar.
Figure 5
Figure 5
Modulation of H-M1 and H-M2 cell phenotype by TREM-1-cross-linking. H-M1 and H-M2 cells generated as described in the legend of Figure 2 were seeded onto plates pre-coated with agonist anti-TREM-1 mAb or control IgG and cultured for additional 24 h under hypoxic conditions. Cells were then harvested, and surface expression of the indicated markers was determined by flow cytometry. (A) Histograms depict the results obtained from a representative of three tested donors. The blue and the red lines represent, respectively, the fluorescent profile of IgG- and TREM-1-triggered cells stained with the indicated Abs; positive cell percentages are indicated. (B) The scatter plots represent the percentage of positive cells from three different donors (dots) with horizontal lines indicating mean values for each group. The bar graphs represent the means of MFI ± SEM of positive cells in three different donors. p value of TREM-1- relative to IgG-triggered H-M1/H-M2 cells: *p ≤ 0.05; **p ≤ 0.01.
Figure 6
Figure 6
Modulation of H-M1 and H-M2 secretory features and endocytic activity by TREM-1-cross-linking. H-M1 and H-M2 cells were crosslinked with the anti-TREM-1 Ab as described in the legend of Figure 5. (A) Cytokine/chemokine secretion. Supernatants were assayed for the indicated cytokines/chemokines content by specific ELISA. Data shown are expressed as fold changes in TREM-1- relative to IgG-crosslinked cells (arbitrarily defined as equal to 1) and represent the mean of five independent experiments. (B) Endocytic activity. Ig- and TREM-1-triggered H-M1/H-M2 cells were incubated with FITC-dextran at 4 and 37°C for 1 h under normoxic and hypoxic conditions, respectively, and then analyzed by flow cytometry. Results are expressed as detailed in the legend of Figure 4B and represent the mean ± SEM of three independent experiments. p value of TREM-1-triggered H-M2 relative to TREM-1-triggered H-M1 and IgG-triggered H-M2 relative to IgG-triggered H-M1 cells: *p ≤ 0.05.
Figure 7
Figure 7
Triggering receptor expressed on myeloid cell (TREM)-1 expression in vivo in Mf from hypoxic oligoarticular juvenile idiopatic arthritis synovial fluid (OJIA-SF). SF mononuclear cells (SFMCs) were purified from children affected by OJIA, stained with anti-CD68-FITC, anti-CD80-PE/Cy7, anti-CD206-APC, and anti-TREM-1-PE mAbs, and analyzed by multicolor flow cytometry on a FACScan. (A) Results from two representative of six OJIA patients are shown as flow cytometry plots. Myeloid cell populations were electronically gated according to their forward/side scatter properties. Gated cells were analyzed for CD68 positivity, and CD68+ cells were then examined for CD80 and CD206 expression. Non-specific staining was corrected using isotype-matched Abs. The percentage of single and double-positive cells within the CD68-gated population is indicated. Upper left quadrants: CD80+/CD206 cells (M1 phenotype); lower right quadrants: CD80CD206+ cells (M2 phenotype). Upper right quadrants: CD80+/CD206+ cells (mixed M1/M2 phenotype); lower left quadrants: control IgGs. Coexpression of TREM-1 in CD80+ and CD206+ cells was then evaluated. Red histograms represent the fluorescent profile of TREM-1-expressing cells, whereas blue histograms represent the fluorescent profile of cells stained with the isotype-matched control Ab. The percentage of TREM-1+ cells in the total CD80+ and CD206+ populations is indicated (B) Percentages of CD80 and CD206 single and double-positive cells within the CD68-gated population and percentages of TREM-1+ cells in the total CD80+ and CD206+ subsets are presented as bar graphs. Results are the mean ± SEM of six independent experiments. *p ≤ 0.05; **p ≤ 0.01; ***p ≤ 0.001.
Figure 8
Figure 8
Modulation of CD80 and CD206 polarization markers by oligoarticular juvenile idiopatic arthritis synovial fluid (OJIA-SF) and LP17 peptide in H-M2 cells. H-M2 cells generated from two different donors were cultured for 24 h under hypoxic conditions with SFs from the OJIA patients analyzed in Figure 7 (three SFs for each H-M2 preparation) in the presence or absence of the TREM-1-specific peptide, LP17 (100 ng/mL). Surface levels of CD80 and CD206 were then determined by flow cytometry. Results are expressed as in the legend of Figure 2B. Scatter plots represent the percentage of positive H-M2 cells untreated or treated with three different SF ± LP17 (dots), with horizontal lines indicating mean values for each group. p value of SF + LP17- relative to SF-treated cells (by two-tailed paired Student’s t-test): *p ≤ 0.05.
Figure 9
Figure 9
High-mobility group box 1 (HMGB1) release in synovial fluid (SF) and plasma from patients affected by oligoarticular juvenile idiopatic arthritis (OJIA). HMGB1 concentrations were quantified by ELISA in paired plasma and SF from the OJIA patients analyzed in Figure 7 and in plasma from five age-matched control subjects. Individual samples were run in duplicate. Results are expressed as ng/mL Boxes show the values falling between the 25th and 75th percentiles, horizontal lines represent mean values, and whiskers the highest and lowest values for each group. p value of SF relative to paired OJIA plasma (by two-tailed paired Student’s t-test): **p < 0.01; p value of SF relative to plasma controls (by two-tailed unpaired Student’s t-test): ***p < 0.001.

Similar articles

Cited by

References

    1. Gordon S, Taylor PR. Monocyte and macrophage heterogeneity. Nat Rev Immunol (2005) 5:953–64.10.1038/nri1733 - DOI - PubMed
    1. Ginhoux F, Guilliams M. Tissue-resident macrophage ontogeny and homeostasis. Immunity (2016) 44:439–49.10.1016/j.immuni.2016.02.024 - DOI - PubMed
    1. Mosser DM, Edwards JP. Exploring the full spectrum of macrophage activation. Nat Rev Immunol (2008) 8:958–69.10.1038/nri2448 - DOI - PMC - PubMed
    1. Murray PJ, Wynn TA. Protective and pathogenic functions of macrophage subsets. Nat Rev Immunol (2011) 11:723–37.10.1038/nri3073 - DOI - PMC - PubMed
    1. Bosco MC, Varesio L. Monocytic cell gene regulation by the hypoxic synovial environment in juvenile idiopathic arthritis: implications for disease pathogenesis. J Clin Rheumatol Musculoskelet Med (2010) 1:47–55.