

Microfibrous Scaffolds Enhance Endothelial Differentiation and Organization of Induced Pluripotent Stem Cells
- PMID: 28936269
- PMCID: PMC5602598
- DOI: 10.1007/s12195-017-0502-y
Microfibrous Scaffolds Enhance Endothelial Differentiation and Organization of Induced Pluripotent Stem Cells
Abstract
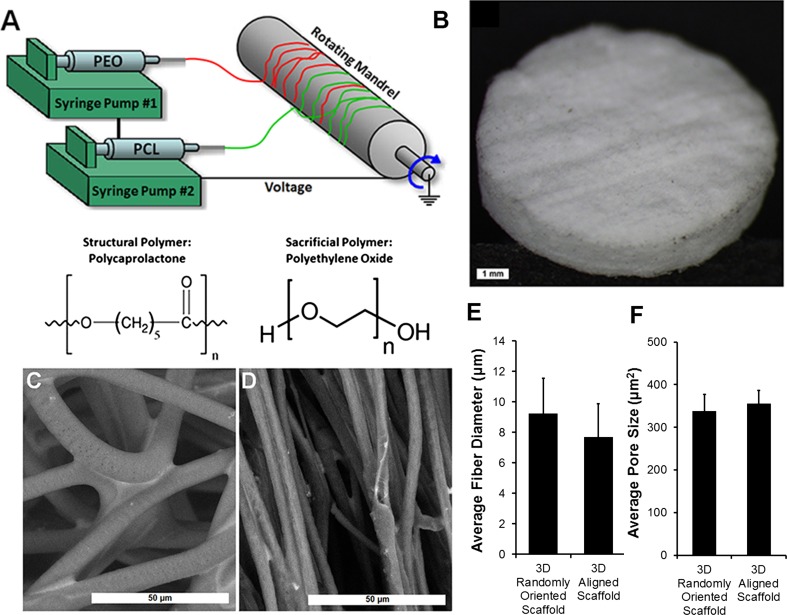
Introduction: Human induced pluripotent stem cells (iPSCs) are a promising source of endothelial cells (iPSC-ECs) for engineering three-dimensional (3D) vascularized cardiac tissues. To mimic cardiac microvasculature, in which capillaries are oriented in parallel, we hypothesized that endothelial differentiation of iPSCs within topographically aligned 3D scaffolds would be a facile one-step approach to generate iPSC-ECs as well as induce aligned vascular organization.
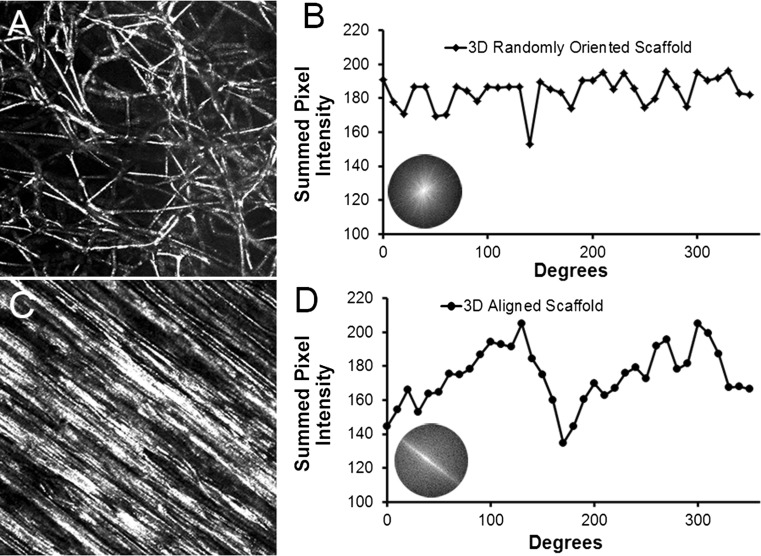
Methods: Human iPSCs underwent endothelial differentiation within electrospun 3D polycaprolactone (PCL) scaffolds having either randomly oriented or parallel-aligned microfibers. Using transcriptional, protein, and endothelial functional assays, endothelial differentiation was compared between conventional two-dimensional (2D) films and 3D scaffolds having either randomly oriented or aligned microfibers. Furthermore, the role of parallel-aligned microfiber patterning on the organization of vessel-like networks was assessed.
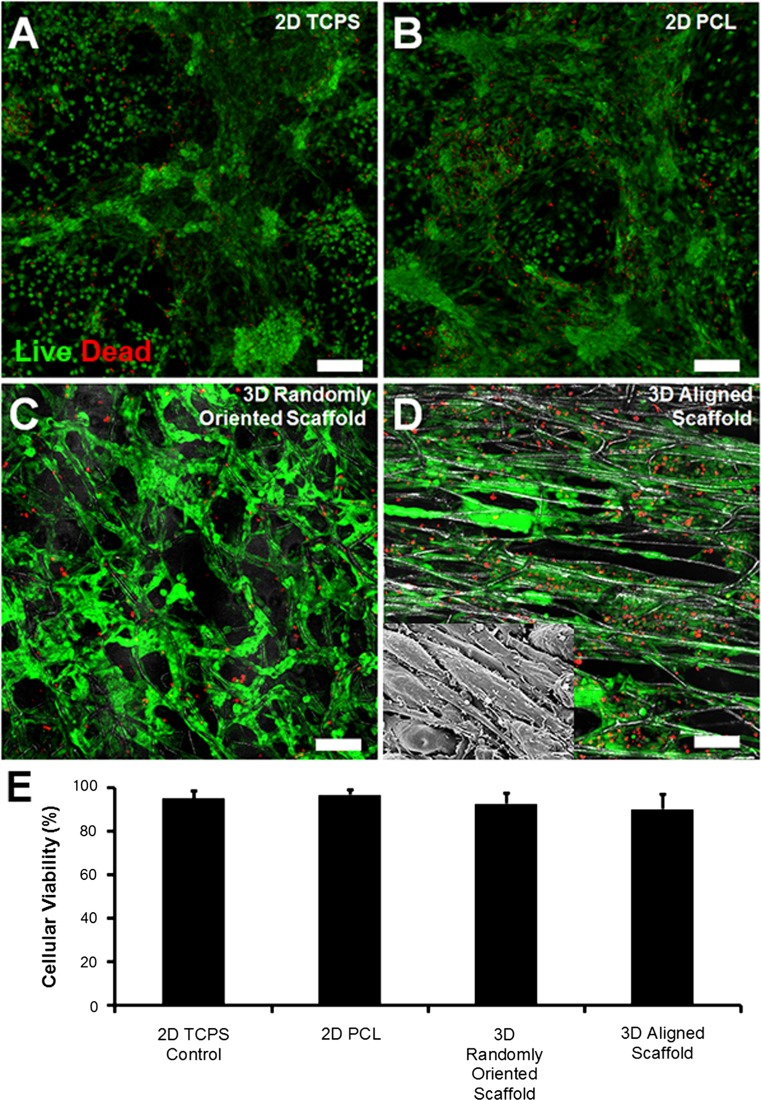
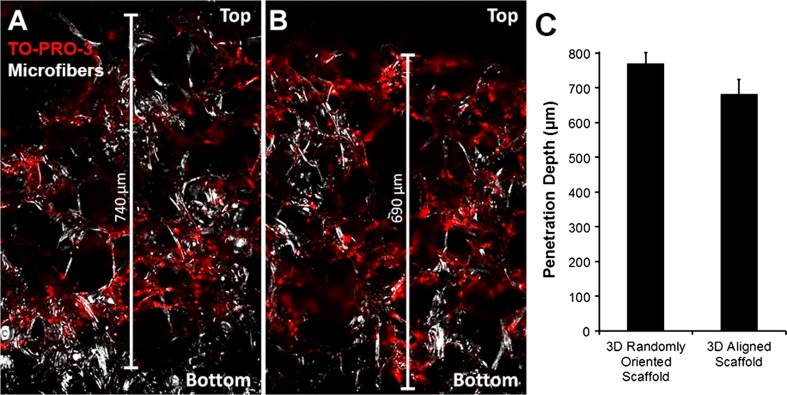
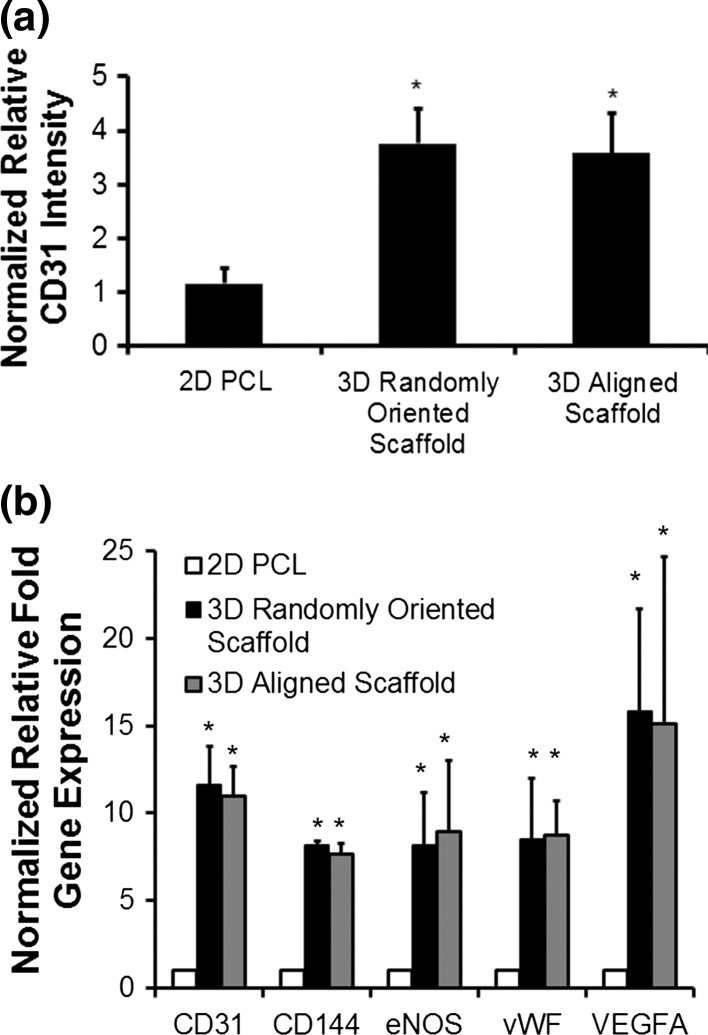
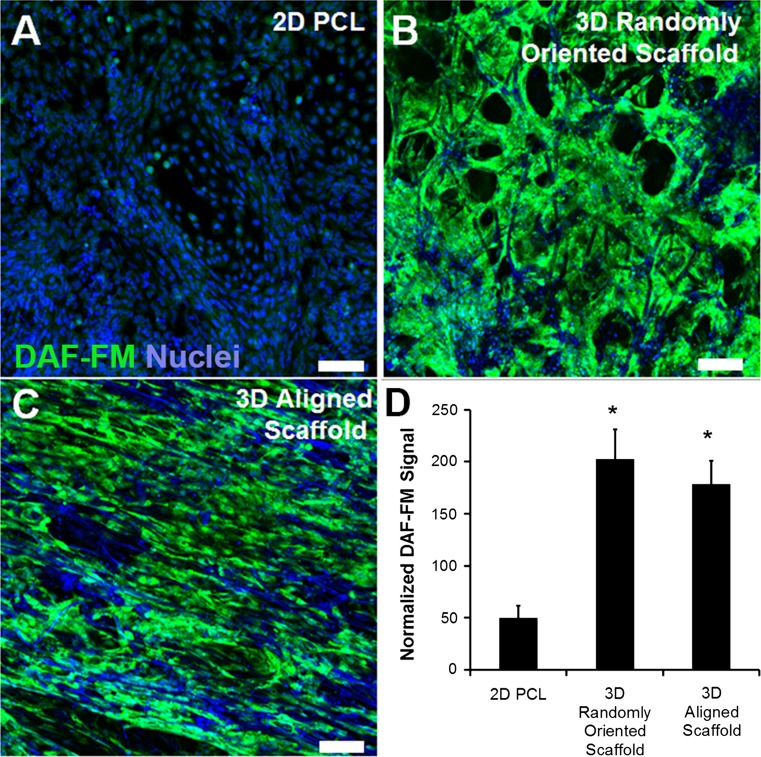
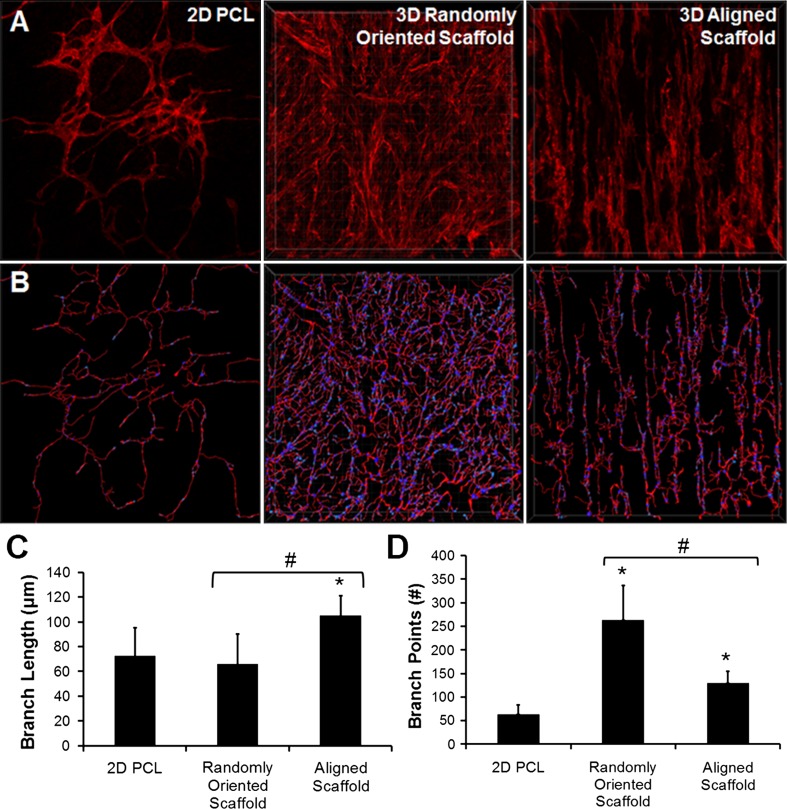
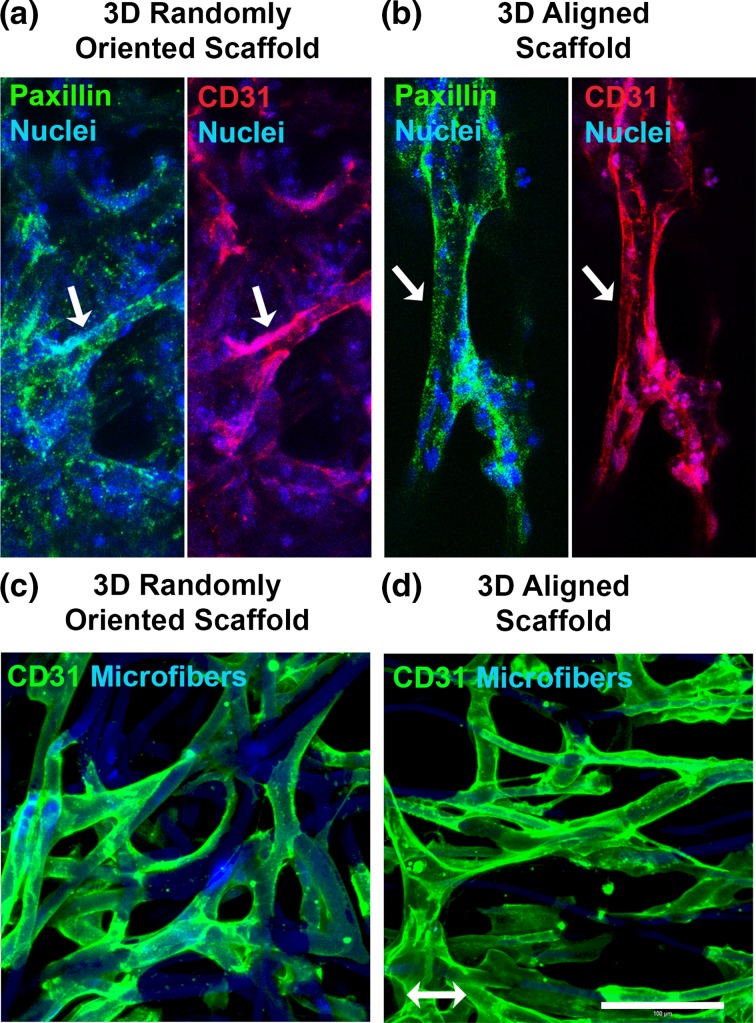
Results: The cells in both the randomly oriented and aligned 3D scaffolds demonstrated an 11-fold upregulation in gene expression of the endothelial phenotypic marker, CD31, compared to cells on 2D films. This upregulation corresponded to >3-fold increase in CD31 protein expression in 3D scaffolds, compared to 2D films. Concomitantly, other endothelial phenotypic markers including CD144 and endothelial nitric oxide synthase also showed significant transcriptional upregulation in 3D scaffolds by >7-fold, compared to 2D films. Nitric oxide production, which is characteristic of endothelial function, was produced 4-fold more abundantly in 3D scaffolds, compared to on 2D PCL films. Within aligned scaffolds, the iPSC-ECs displayed parallel-aligned vascular-like networks with 70% longer branch length, compared to cells in randomly oriented scaffolds, suggesting that fiber topography modulates vascular network-like formation and patterning.
Conclusion: Together, these results demonstrate that 3D scaffold structure promotes endothelial differentiation, compared to 2D substrates, and that aligned topographical patterning induces anisotropic vascular network organization.
Keywords: anisotropy; endothelial cell; induced pluripotent stem cell; three-dimensional scaffolds; tissue engineering; topography; vascularization.
Conflict of interest statement
Conflict of Interest The authors (Joseph J. Kim, Luqia Hou, Guang Yang, Nicholas P. Mezak, Maureen Wanjare, Lydia M. Joubert, and Ngan F. Huang) declare that they have no conflicts of interest.
Figures
Similar articles
-
Vascularization of Engineered Spatially Patterned Myocardial Tissue Derived From Human Pluripotent Stem Cells in vivo.Front Bioeng Biotechnol. 2019 Sep 3;7:208. doi: 10.3389/fbioe.2019.00208. eCollection 2019. Front Bioeng Biotechnol. 2019. PMID: 31552234 Free PMC article.
-
Anisotropic microfibrous scaffolds enhance the organization and function of cardiomyocytes derived from induced pluripotent stem cells.Biomater Sci. 2017 Jul 25;5(8):1567-1578. doi: 10.1039/c7bm00323d. Biomater Sci. 2017. PMID: 28715029 Free PMC article.
-
3D Microfibrous Scaffolds Selectively Promotes Proliferation and Glial Differentiation of Adult Neural Stem Cells: A Platform to Tune Cellular Behavior in Neural Tissue Engineering.Macromol Biosci. 2019 Feb;19(2):e1800236. doi: 10.1002/mabi.201800236. Epub 2018 Nov 27. Macromol Biosci. 2019. PMID: 30480879
-
Electrospun three-dimensional aligned nanofibrous scaffolds for tissue engineering.Mater Sci Eng C Mater Biol Appl. 2018 Nov 1;92:995-1005. doi: 10.1016/j.msec.2018.06.065. Epub 2018 Jun 30. Mater Sci Eng C Mater Biol Appl. 2018. PMID: 30184829 Review.
-
Synthetic scaffolds for musculoskeletal tissue engineering: cellular responses to fiber parameters.NPJ Regen Med. 2019 Jun 27;4:15. doi: 10.1038/s41536-019-0076-5. eCollection 2019. NPJ Regen Med. 2019. PMID: 31263573 Free PMC article. Review.
Cited by
-
Vascularization of Engineered Spatially Patterned Myocardial Tissue Derived From Human Pluripotent Stem Cells in vivo.Front Bioeng Biotechnol. 2019 Sep 3;7:208. doi: 10.3389/fbioe.2019.00208. eCollection 2019. Front Bioeng Biotechnol. 2019. PMID: 31552234 Free PMC article.
-
iPSCs: A powerful tool for skeletal muscle tissue engineering.J Cell Mol Med. 2019 Jun;23(6):3784-3794. doi: 10.1111/jcmm.14292. Epub 2019 Apr 1. J Cell Mol Med. 2019. PMID: 30933431 Free PMC article. Review.
-
Engineering Cardiovascular Tissue Chips for Disease Modeling and Drug Screening Applications.Front Bioeng Biotechnol. 2021 Apr 20;9:673212. doi: 10.3389/fbioe.2021.673212. eCollection 2021. Front Bioeng Biotechnol. 2021. PMID: 33959600 Free PMC article. Review.
-
Technology for the formation of engineered microvascular network models and their biomedical applications.Nano Converg. 2024 Mar 2;11(1):10. doi: 10.1186/s40580-024-00416-7. Nano Converg. 2024. PMID: 38430377 Free PMC article. Review.
-
Bioceramic akermanite enhanced vascularization and osteogenic differentiation of human induced pluripotent stem cells in 3D scaffolds in vitro and vivo.RSC Adv. 2019 Aug 14;9(44):25462-25470. doi: 10.1039/c9ra02026h. eCollection 2019 Aug 13. RSC Adv. 2019. PMID: 35530104 Free PMC article.
References
-
- Abbasi N, Hashemi SM, Salehi M, Jahani H, Mowla SJ, Soleimani M, Hosseinkhani H. Influence of oriented nanofibrous pcl scaffolds on quantitative gene expression during neural differentiation of mouse embryonic stem cells. J Biomed Mater Res A. 2016;104:155–164. doi: 10.1002/jbm.a.35551. - DOI - PubMed
Grants and funding
LinkOut - more resources
Full Text Sources
Other Literature Sources
