. 2017 Aug 4;4(3):385-404.
doi: 10.1016/j.jcmgh.2017.07.005. eCollection 2017 Nov.

Porcine Esophageal Submucosal Gland Culture Model Shows Capacity for Proliferation and Differentiation

Affiliations

Porcine Esophageal Submucosal Gland Culture Model Shows Capacity for Proliferation and Differentiation

Richard J von Furstenberg et al. Cell Mol Gastroenterol Hepatol. .

Abstract

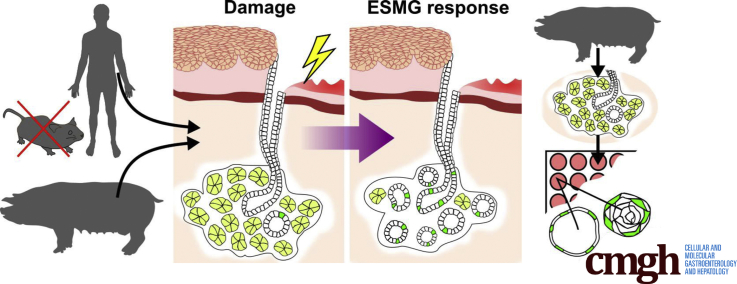
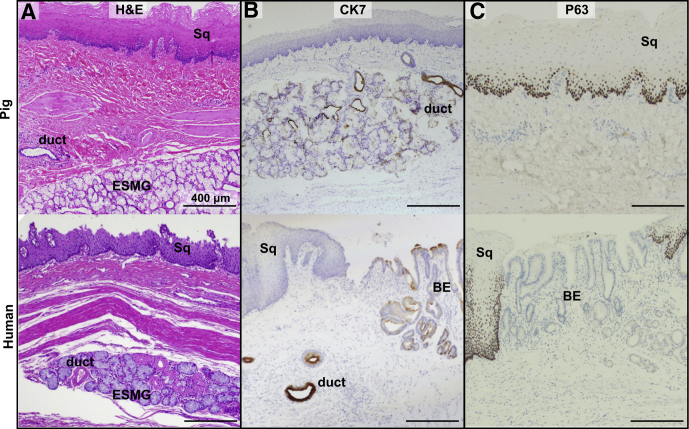
Background & aims: Although cells comprising esophageal submucosal glands (ESMGs) represent a potential progenitor cell niche, new models are needed to understand their capacity to proliferate and differentiate. By histologic appearance, ESMGs have been associated with both overlying normal squamous epithelium and columnar epithelium. Our aim was to assess ESMG proliferation and differentiation in a 3-dimensional culture model.

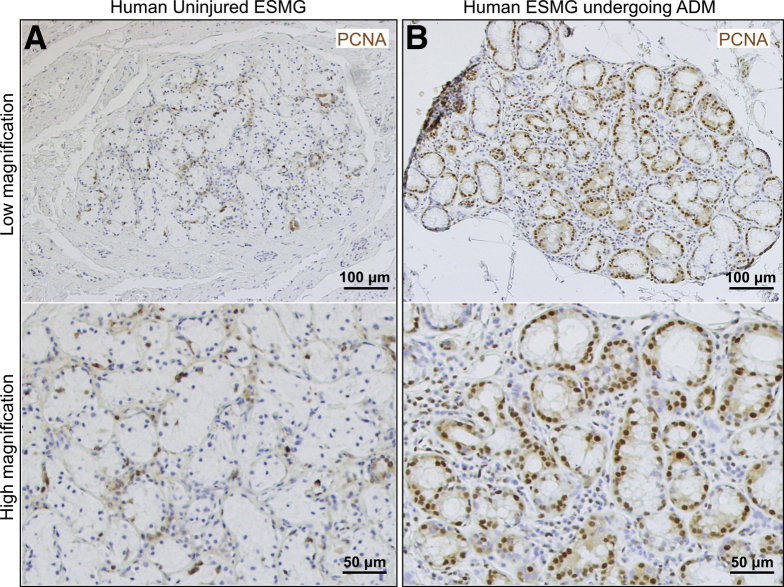
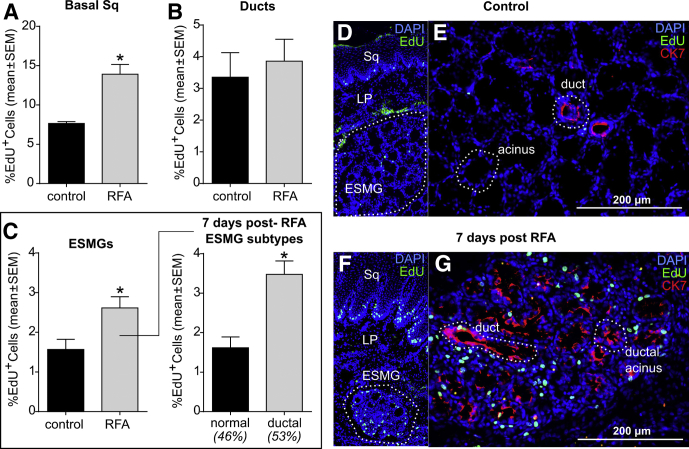
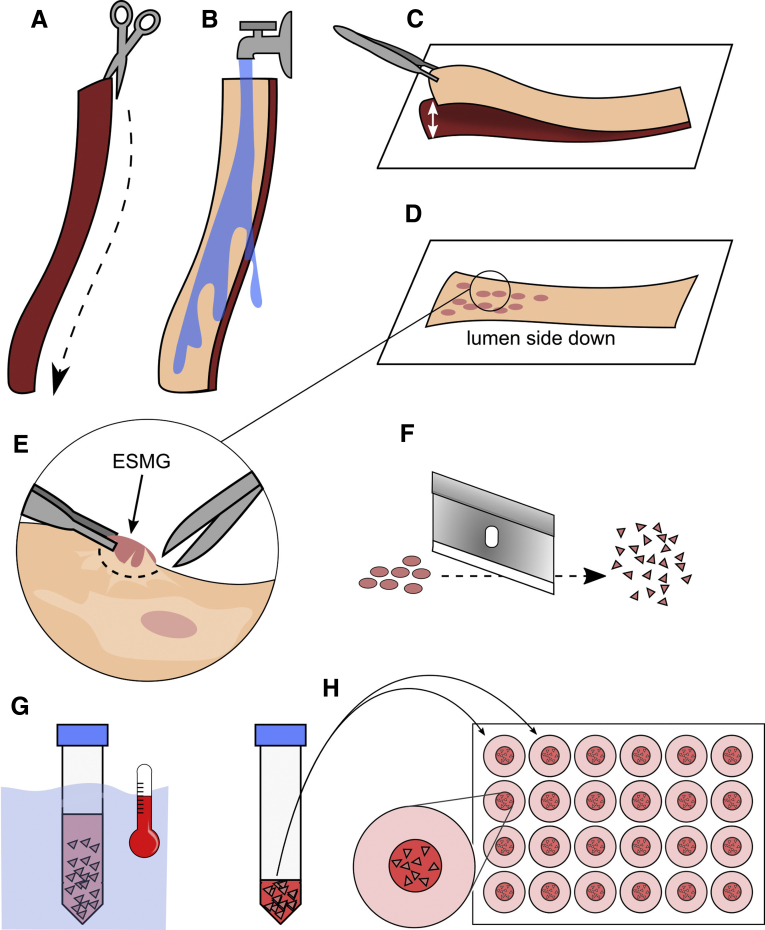
Methods: We evaluated proliferation in human ESMGs from normal and diseased tissue by proliferating cell nuclear antigen immunohistochemistry. Next, we compared 5-ethynyl-2'-deoxyuridine labeling in porcine ESMGs in vivo before and after esophageal injury with a novel in vitro porcine organoid ESMG model. Microarray analysis of ESMGs in culture was compared with squamous epithelium and fresh ESMGs.

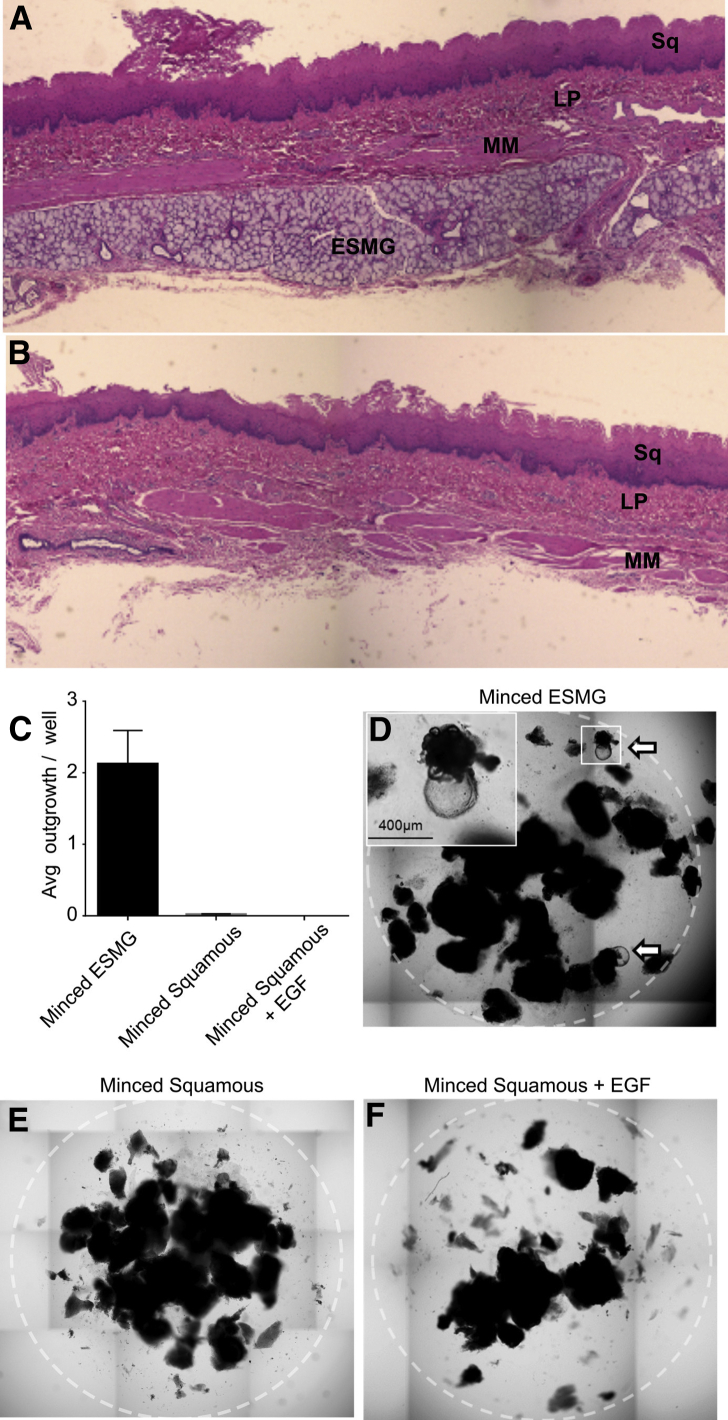
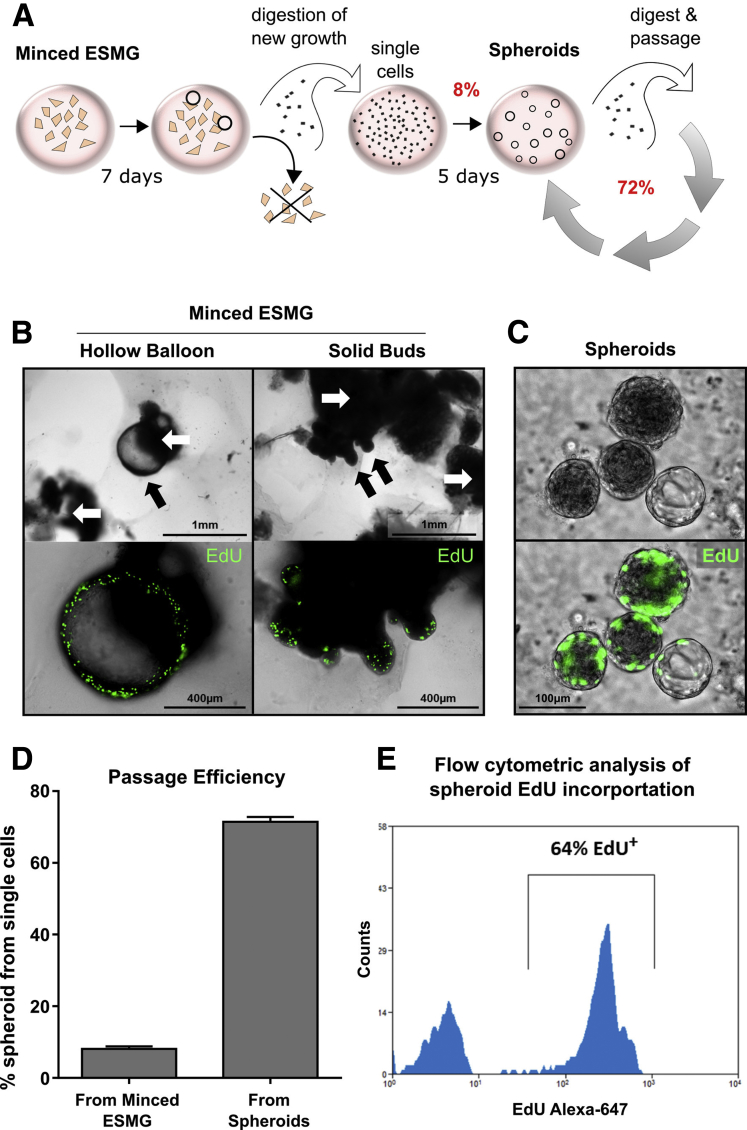
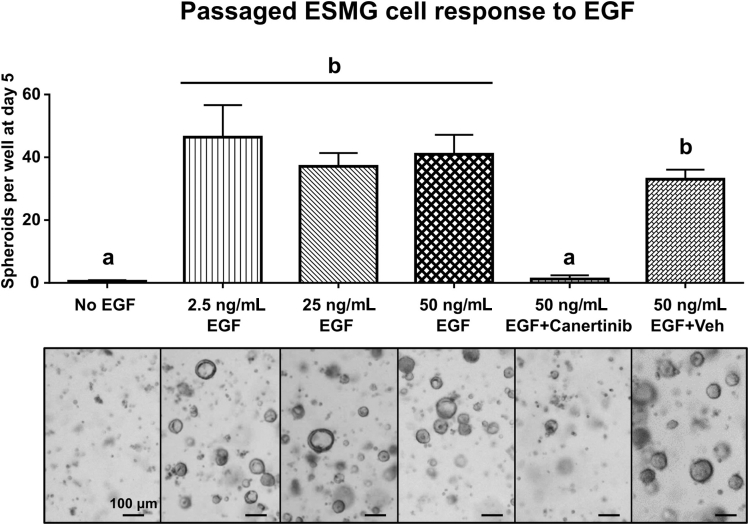
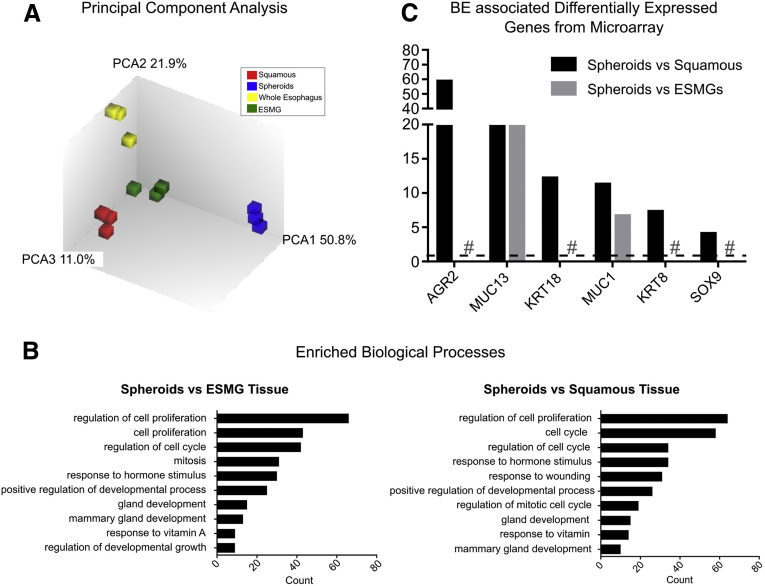
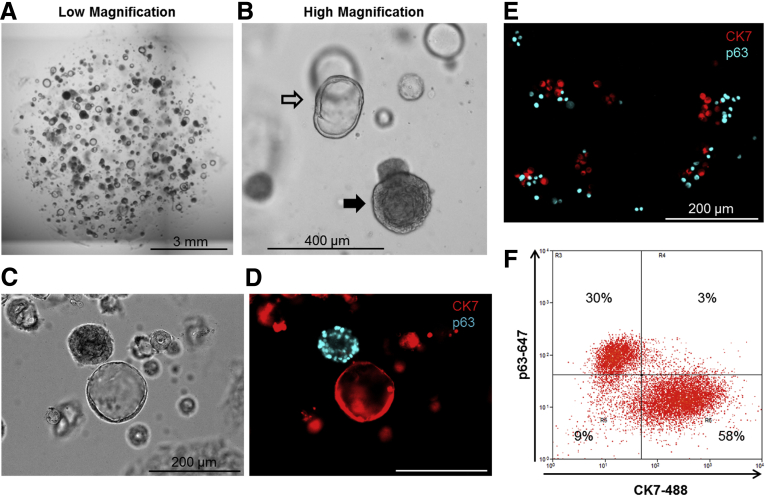
Results: Marked proliferation was observed in human ESMGs of diseased tissue. This activated ESMG state was recapitulated after esophageal injury in an in vivo porcine model, ESMGs assumed a ductal appearance with increased proliferation compared with control. Isolated and cultured porcine ESMGs produced buds with actively cycling cells and passaged to form epidermal growth factor-dependent spheroids. These spheroids were highly proliferative and were passaged multiple times. Two phenotypes of spheroids were identified: solid squamous (P63+) and hollow/ductal (cytokeratin 7+). Microarray analysis showed spheroids to be distinct from parent ESMGs and enriched for columnar transcripts.

Conclusions: Our results suggest that the activated ESMG state, seen in both human disease and our porcine model, may provide a source of cells to repopulate damaged epithelium in a normal manner (squamous) or abnormally (columnar epithelium). This culture model will allow the evaluation of factors that drive ESMGs in the regeneration of injured epithelium. The raw microarray data have been uploaded to the National Center for Biotechnology Information Gene Expression Omnibus (accession number: GSE100543).

Keywords: 3D Culture; 3D, 3-dimensional; ANOVA, analysis of variance; Acinar Ductal Metaplasia; Adult Stem Cell; BE, Barrett’s esophagus; Barrett’s Esophagus; CK7, cytokeratin 7; DMSO, dimethyl sulfoxide; EAC, esophageal adenocarcinoma; EGF, epidermal growth factor; ESMG, esophageal submucosal gland; EdU, 5-ethynyl-2′-deoxyuridine; Esophagus; IHC, immunohistochemistry; PBS, phosphate-buffered saline; PCNA, proliferating cell nuclear antigen; RFA, radiofrequency ablation.


Figures

None
Graphical abstract
Figure 1
Figure 1
Similarity of porcine and human esophagus. (A) Pig (top row) and human (bottom row) esophagus both contain ESMGs and share overall architecture as shown by H&E staining. (B) The CK7 antibody labels the columnar ductal epithelium in pigs, and in human beings the CK7 antibody labels ducts and BE. (C) Conversely, P63 antibody marks squamous (Sq) epithelium in pigs and human beings, most strongly in the basal squamous layer. An absence of P63 can be seen in the BE patch of the human tissue.
Figure 2
Figure 2
Human ESMGs show proliferation in association with acinar ductal metaplasia (ADM). (A) A normal ESMG from a human autopsy case without overlying esophageal injury or cancer shows little proliferation at baseline as shown by proliferating cell nuclear antigen staining. (B) An abnormal ESMG from a human esophagectomy case with esophageal adenocarcinoma shows the ductular phenotype within the ESMG with a marked increase in PCNA staining for proliferation.
Figure 3
Figure 3
Porcine ESMGs become hyperproliferative with a ductular phenotype after in vivo damage to the overlying epithelium. The percentage of EdU+ nuclei within the basal squamous epithelial layer, ducts, and ESMGs was compared between 2 animals: 1 control and the other 7 days after RFA. (A) EdU+ nuclei increased in the basal squamous cells after RFA. (B) Ducts did not show a significant increase in proliferation after RFA. (C) However, after RFA, activated ESMGs with the ductal phenotype were found in 53% of ESMGs. After injury, activated ESMGs showed significantly more EdU label than control. (D) Low-power esophageal tissue section scan from the control animal labeled with EdU azide dye (green) to mark cells in the S-phase and 4′,6-diamidino-2-phenylindole (DAPI; blue) marking all nuclei. The white dashed border marks the ESMG perimeter, and the squamous layer and lamina propria are labeled Sq and LP, respectively. (E) Higher-power image of an ESMG from the control animal labeled with DAPI (blue), EdU (green), and ductal marker CK7 (red). An example of a duct and acinus are outlined with a dashed white line. (F) Low-power scan of esophageal section from an animal 7 days after RFA shows an active ESMG with increased proliferation. (G) Higher-power image of a representative ESMG from an animal 7 days after RFA, EdU (green), CK7 (red), and DAPI (blue). This ESMG has an activated ductal phenotype with increased CK7 within the ESMG compared with control. An example of a CK7-positive duct and a ductal acinus are marked with white dashed borders.
Figure 4
Figure 4
ESMGs are prepared for in vitro 3D culture. (A) The esophagus is opened longitudinally. (B) Vigorous washing is performed. (C) The epithelial layer is peeled off the muscle layers. (D) ESMGs are exposed for dissection by placing luminal side down on a dissecting board. (E) ESMGs are dissected. (F) ESMGs are minced. (G) Minced ESMGs are incubated with minimal media and antibiotics (see the Materials and Methods section for details). (H) Minced ESMGs are plated into Matrigel for culture.
Figure 5
Figure 5
ESMG cells activate and proliferate in vitro after mincing. (A) ESMGs were present in the epithelial layer after it was peeled off the muscle layer. (B) ESMGs were dissected away from the muscularis mucosa, avoiding the squamous stem/progenitor cells and leaving the squamous layer intact. (C) Minced ESMGs formed an average of 2 outgrowths per well. (D) After 7 days, minced ESMGs produced new multicellular outgrowths as indicated with arrows. (E) In comparison and as a control, minced squamous epithelium did not produce outgrowths. (F) Addition of EGF to squamous culture conditions also did not produce outgrowths. Avg, average; LP, lamina propria; MM, muscularis mucosa; Sq, squamous.
Figure 6
Figure 6
Digestion of minced ESMGs in culture yields proliferative spheroids. (A) After a gentle digestion, the single cells from the new growth were separated from their originating ESMG fragments and plated in growth factor–reduced Matrigel. These single cells formed multicellular spheroids that could be digested and passaged repeatedly. (B) Whole mount of minced outgrowths were both hollow and solid and both outgrowth types expressed EdU. White arrows indicate originating ESMG fragments and black arrows denote new outgrowths. (C) Digested outgrowths from minced ESMGs produced spheroids and examples of the spheroids are shown in whole mount with bright-field microscopy (top); the same spheroids are shown with fluorescence (bottom), where the spheroids showed extensive EdU positivity in green. (D) Cells (means ± SEM, 8% ± 0.6%) were passaged successfully from the minced ESMG-generated spheroids, and 72% ± 1% (means ± SEM) of cells subsequently passaged from spheroids reformed these multicellular units. (E) Edu-treated spheroids from 2 pigs were digested to single cells, pooled, and analyzed for EdU positivity by flow cytometry, 64% of the cells were EdU+.
Figure 7
Figure 7
ESMG-derived spheroids are EGF-dependent. Spheroid formation from passaged cells was evaluated at day 5 after the following treatments: no EGF; 2.5 ng/mL recombinant EGF (rEGF); 25 ng/mL rEGF; 50 ng/mL rEGF; 50 ng/mL rEGF + canertinib (CI-1033), an irreversible pan-EGFR blocker; or 50 ng/mL rEGF with DMSO vehicle without the canertinib. The number of spheroids per well for the treatment groups was 0.5% ± 0.4%, 46% ± 10%, 37% ± 4%, 41% ± 6%, and 1.2% ± 1.2%, and 33% ± 3% for vehicle alone, means ± SEM respectively. Groups labeled under a are statistically significant from groups under b (P < .05; n = 3). Representative bright-field images are shown below the condition listed. Veh, vehicle without canertinib.
Figure 8
Figure 8
ESMG-derived spheroids show a unique transcriptomic signature and increased expression of BE-associated genes by microarray. (A) Principal component analysis (PCA) plot of microarray data comparing squamous epithelium, ESMGs, spheroids generated from ESMGs in 3D culture, and whole uninjured porcine esophagus show distinct clusters for each group. Importantly, the activated ESMG spheroids in culture assume a unique profile distinct from ESMGs of origin. (B) Biologic processes gene ontology analysis using the Database for Annotation showed that cultured spheroids compared with squamous epithelium and cultured spheroids in culture compared with freshly dissected ESMGs showed increased cell proliferation, cell-cycle markers, hormone responses, and gland development. The ESMGs in culture compared with squamous also showed responses to wound healing, reflecting their activated state in culture. (C) Established BE markers represented on the porcine microarray were assessed in spheroids in 3D culture compared with squamous epithelium and showed increased expression of several known BE markers including AGR2, MUC13, KRT18, MUC1, KRT8, and SOX9. Only MUC13 and MUC1 were increased in ESMG spheroid culture compared with dissected ESMGs. Hash marks show where there was no significant difference in expression between ESMG spheroid culture and freshly dissected ESMGs.
Figure 9
Figure 9
Spheroids generated from ESMGs develop 2 distinct phenotypes. (A) With a 4× objective, a mix of the 2 spheroid phenotypes can be observed. (B) A higher-power bright-field image of a ductal (hollow arrow) and a squamous (solid arrow) phenotype are shown. (C and D) One spheroid phenotype (ductal) is characterized by the CK7 marker found in ESMGs and ducts as well as in Barrett’s esophagus (BE) and the other spheroid phenotype is characterized by P63, a known squamous marker that is lost in BE. (E) Single cells isolated from spheroids fixed and labeled with antibodies against CK7 (red) and P63 (blue) viewed under a wide-field fluorescent microscope. (F) Cells from the same preparation shown in panel E evaluated by flow cytometry and represented on a bivariate histogram.

Similar articles

Cited by

References

    1. Shi L., Der R., Ma Y., Peters J., Demeester T., Chandrasoma P. Gland ducts and multilayered epithelium in mucosal biopsies from gastroesophageal-junction region are useful in characterizing esophageal location. Dis Esophagus. 2005;18:87–92. - PubMed
    1. van Nieuwenhove Y., Destordeur H., Willems G. Spatial distribution and cell kinetics of the glands in the human esophageal mucosa. Eur J Morphol. 2001;39:163–168. - PubMed
    1. Mills J.C., Sansom O.J. Reserve stem cells: differentiated cells reprogram to fuel repair, metaplasia, and neoplasia in the adult gastrointestinal tract. Sci Signal. 2015;8:re8. - PMC - PubMed
    1. McDonald S.A.C., Graham T.A., Lavery D.L., Wright N.A., Jansen M. The Barrett's gland in phenotype space. Cell Mol Gastroenterol Hepatol. 2015;1:41–54. - PMC - PubMed
    1. Howlader N, Noone AM, Krapcho M, Garshell J, Neymann N, Altekruse SF, Kosary CL, Yu M, Ruhl J, Tatalovich Z, Mariotto A, Lewis DR, Chen HS, Feuer EJ, Cronin KA, eds. SEER cancer statistics review, 1975-2011 Bethesda, MD: National Cancer Institute; 2014 based on November 2013 SEER data submission, posted to the SEER web site, April 4. Available from: http://seer.cancer.gov/csr/1975_2011. Accessed October 17, 2014.