. 2017 Aug 22;1(19):1478-1490.
doi: 10.1182/bloodadvances.2017006726.

Platelet dense granules begin to selectively accumulate mepacrine during proplatelet formation

Affiliations

Platelet dense granules begin to selectively accumulate mepacrine during proplatelet formation

Hayley A Hanby et al. Blood Adv. .

Abstract

Platelet dense granules (DGs) are storage organelles for calcium ions, small organic molecules such as ADP and serotonin, and larger polyphosphates that are secreted upon platelet stimulation to enhance platelet activation, adhesion, and stabilization at sites of vascular damage. DGs are thought to fully mature within megakaryocytes (MKs) prior to platelet formation. Here we challenge this notion by exploiting vital fluorescent dyes to distinguish mildly acidic DGs from highly acidic compartments by microscopy in platelets and MKs. In isolated primary mouse platelets, compartments labeled by mepacrine - a fluorescent weak base that accumulates in DGs - are readily distinguishable from highly acidic compartments, likely lysosomes, that are labeled by the acidic pH indicator, LysoTracker, and from endolysosomes and alpha granules labeled by internalized and partially digested DQ™ BSA. By contrast, in murine fetal liver- and human CD34+ cell-derived MKs and the megakaryocytoid cell lines, MEG-01 and differentiated G1ME2, labeling by mepacrine overlapped nearly completely with labeling by LysoTracker and partially with labeling by DQ™ BSA. Mepacrine labeling in G1ME2-derived MKs was fully sensitive to proton ATPase inhibitors, but was only partially sensitive in platelets. These data indicate that mepacrine in MKs accumulates as a weak base in endolysosomes but is likely pumped into or retained in separate DGs in platelets. Fluorescent puncta that labeled uniquely for mepacrine were first evident in G1ME2-derived proplatelets, suggesting that DGs undergo a maturation step that initiates in the final stages of MK differentiation.

Keywords: dense granule; live cell imaging; lysosome; lysosome-related organelle; megakaryocyte; platelets; proplatelet.


Conflict of interest statement

DISCLOSURE OF CONFLICTS OF INTEREST The authors declare no competing financial interests.

Figures

None
Graphical abstract
Figure 1.
Figure 1.
Mepacrine accumulates in structures distinct from lysosomes in platelets. (A-B) Shown are deconvolved, single-plane images from a z-series image stack of 3 individual platelets labeled with each combination individually or together (merge), along with a corresponding differential interference contrast image (DIC). Puncta are labeled by mepacrine (arrows) or by DQ BSA or LysoTracker (arrowheads). The cell outline is based on the DIC image (white dotted line). Scale bars, 1 μm. Platelets were incubated with 50 μM mepacrine (green) and either 10 μg/mL DQ BSA (red; A) or 200 nM LysoTracker Red DND-99 (red; B) for 30 min and analyzed by fluorescence microscopy. (C-D) Quantification of both the degree (mean ± SD) of mepacrine colocalization with DQ BSA or LysoTracker (N = 105 platelets each from 3 individual experiments) and the number of puncta per platelet (mean ± SD) labeled by mepacrine alone (#mep-only), LysoTracker alone (#LyTr-only), DQ BSA alone (#DQ-BSA-only) or by both mepacrine/LysoTracker or mepacrine/DQ BSA (# coloc.). (E) Shown is a deconvolved, single-plane image of a field of platelets labeled with mepacrine (Mep, green) and DQ BSA (red) individually or merged, along with corresponding DIC image. Scale bar, 1 μm. Platelets were analyzed by wide field microscopy at room temperature with a Leica DM IRBE equipped with a 100× Plan Apochromat objective lens (1.4 NA), a Hamamatsu Orca Flash 4 digital CMOS camera, and Leica Application Suite software. Imaging medium was modified, calcium-free Tyrode’s buffer. Deconvolution was performed in Leica Application Suite software using Gold’s iterative deconvolution algorithm. Mepacrine has an excitation/emission of 436/525 nm; LysoTracker Red excitation/emission: 577/590 nm; DQ BSA excitation/emission: ∼590/∼620 nm. Coloc., colocalization; DIC, differential interference contrast; LyTr, LysoTracker; Mep, mepacrine; n/a, not applicable.
Figure 2.
Figure 2.
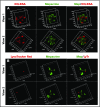
3D reconstruction of labeled platelets. Z series of images of platelets shown in Figure 1 were subjected to 3D rendering to emphasize the distinct distribution of puncta labeled by DQ BSA (A; red) or LysoTracker Red DND-99 (B; red) from those labeled by mepacrine in 3D space. (A) Platelet from the first row of Figure 1A is shown in 2 views (view 1: 169°, −12°, −169° [X, Y, Z]; view 2: 8°, −12°, 141°). (B) Platelet from the first row of Figure 1B is shown in 2 views (view 1: −7°, 3°, 17°; view 2: −172°, −3°, 112°). The x- and y-axes are labeled for scale in micrometers. Three-dimensional reconstruction was performed with Leica Application Suite software.
Figure 3.
Figure 3.
Mepacrine labeling is less sensitive to deacidification than LysoTracker labeling in platelets. (A) Platelets were pretreated with vehicle or with bafA1 and then labeled with mepacrine (green) and LysoTracker Red DND-99 (red) together with vehicle or 100 nM bafA1 for 30 min. Shown is a single-plane image of a single platelet from each treatment, showing each label alone or merged (Mep/LyTr) and the corresponding DIC image; the middle and lower panels are raw images, and the upper panels are deconvolved images of the middle panels. The cell outline is based on the DIC image (dotted line). Scale bar, 1 μm. (B) Quantification of fluorescence intensities of mepacrine or LysoTracker Red in control or bafA1-treated cells (taken from raw images), expressed as a percentage of the untreated control (mean ± SD). N = 105 platelets from 3 separate experiments. Platelets were analyzed by wide-field microscopy at room temperature with a Leica DM IRBE equipped with a 100× Plan Apochromat objective lens (1.4 NA), a Hamamatsu Orca Flash 4 CMOS camera, and Leica Application Suite software. Imaging medium was modified, calcium-free Tyrode’s buffer. Deconvolution was performed with Leica Application Suite software using 3 iterations of Gold’s iterative deconvolution algorithm. Mepacrine has an excitation/emission of 436/525 nm; LysoTracker Red excitation/emission: 577/590 nm. ****P < .0001.
Figure 4.
Figure 4.
Mepacrine labels acidic endolysosomes in MKs. Murine fetal liver-derived MKs (FL-MKs) (A,D-E), G1ME2 cells differentiated for 3-4 days to MKs (G1ME2-MK) (B,D-E), or human CD34-positive HPC-derived MKs (CD34+ MK) (C-E) were incubated with 50 μM mepacrine (green) and 200 nM LysoTracker Red DND-99 (red) for 30 min; cells in panel B were also incubated with Alexa Fluor-647-conjugated anti-CD41 antibody. Images are of a single plane; panel C is deconvolved. In panels A and C, a corresponding DIC image is shown, and the cell outline is indicated by the dotted line (A-C). In panel B, CD41 labeling is also shown; ×2 magnification of boxed regions (insets); examples of overlap between mepacrine and LysoTracker (arrowheads). Scale bars, 5 μm. (D) The number (mean ± SD) of puncta per platelet labeled by mepacrine alone (#mep-only), LysoTracker Red alone (#LyTr-only), or both (#coloc.) in G1ME2-MK (n = 33), FL-MK (n = 30), and CD34+ MK (n = 43). (E) Quantification of the percentage (mean ± SD) of mepacrine labeling that colocalized with LysoTracker Red labeling in each cell type (n = 33 G1ME2-MK; n = 30 FL-MK; n = 43 CD34+ MK). Values are normalized to 100% for overlap of LysoTracker Red with LysoTracker Green DND-26 in G1ME2-MK (n = 79). Fetal-liver MKs were imaged by spinning-disk confocal microscopy at room temperature with an Olympus IX71 inverted microscope equipped with a Hamamatsu ImagEM EM-CCD camera, a 60× Plan Apo water immersion objective (1.2 NA), and MetaMorph software. G1ME2-MKs were imaged by spinning-disk confocal microscopy at room temperature with an Ultraview inverted microscope equipped with a 63× Plan Apochromat lens, a Hamamatsu Orca-ER CCD camera, and Volocity software. CD34+ MKs were imaged by wide-field microscopy at room temperature with a Leica DM IRBE equipped with a 100× Plan Apochromat objective lens (1.4 NA), a Hamamatsu Orca Flash 4 CMOS camera, and Leica Application Suite software. Imaging medium was IMDM. Mepacrine has an excitation/emission of 436/525 nm; LysoTracker Red excitation/emission: 577/590 nm. LyTrG, LysoTracker Green; LyTrR, LysoTracker Red.
Figure 5.
Figure 5.
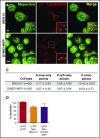
Mepacrine and LysoTracker accumulate in the same compartments in MEG-01 and undifferentiated G1ME2 MK-erythroid progenitors. MEG-01 cells (A,C-D) or G1ME2 MK-erythroid progenitor cells (G1ME2-MEP) (B,C-D) were incubated with 50 μM mepacrine (green) and 200 nM LysoTracker Red DND-99 (red) for 30 min. Images are of a single plane and not deconvolved. Scale bar, 5 μm; ×2 magnifications of boxed regions (insets); examples of overlap (arrows). (C) Quantification of the number (mean ± SD) of puncta per platelet labeled by mepacrine alone (# mep-only), LysoTracker Red alone (# LyTr-only), or both (# coloc.) in 30 cells of each type. (D) Quantification of the percentage (mean ± SD) of mepacrine labeling that colocalized with LysoTracker in MEG-01 (n = 37) and G1ME2-MEP (n = 43) cells, normalized to values for colocalization of LysoTracker Red with LysoTracker Green DND-26 in G1ME2-MK (N = 79), as in Figure 4. MEG-01 cells and G1ME2-MEPs were imaged by spinning-disk confocal microscopy at room temperature with an Ultraview inverted microscope equipped with a 63× Plan Apochromat lens, a Hamamatsu Orca-ER CCD camera, and Volocity software. Imaging medium was IMDM. Mepacrine has an excitation/emission of 436/525 nm; LysoTracker Red excitation/emission: 577/590 nm.
Figure 6.
Figure 6.
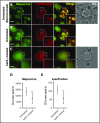
Labeling by mepacrine and by LysoTracker are equally sensitive to deacidification in G1ME2-derived MKs. G1ME2-MKs were pretreated with vehicle alone (untreated) (A-B) or 100 nM bafA1 (C) for 30 min and then labeled with 50 μM mepacrine (green) and 200 nM LysoTracker Red DND-99 for another 30 min in the presence of vehicle or bafA1. Each of the images in panel A are deconvolved from raw, single-plane images shown in panel B; the images in panel C are raw. Corresponding DIC images are shown in panels A and C, and cell outlines based on DIC images are shown by the dotted line. Scale bars, 5 μm; ×2.5 magnifications of boxed region (insets). (D,E) Quantification of the standard deviation in signal intensity of labeling by mepacrine (D) and LysoTracker (E) in vehicle-treated cells (untreated; n = 30) or with bafA1 (n = 30). The difference in signal intensity between treatments was evaluated by unpaired 2-tailed t test. G1ME2-MKs were imaged by spinning-disk confocal microscopy at room temperature with an Ultraview inverted microscope equipped with a 63× Plan Apochromat lens, a Hamamatsu Orca-ER CCD camera, and Volocity software. Imaging medium was IMDM. Mepacrine has an excitation/emission of 436/525 nm; LysoTracker Red excitation/emission: 577/590 nm. **P < .01. int., intensity.
Figure 7.
Figure 7.
Structures labeled by mepacrine but not by LysoTracker are first observed in proplatelets. (A-B) G1ME2 cells differentiated for 5-6 days to proplatelets were incubated with 50 μM mepacrine (green) and 200 nM LysoTracker Red DND-99 (red) for 30 min. The panels show raw images of 2 G1ME2-derived proplatelet strings (G1ME2-proplatelet), magnified from the boxed region shown in the corresponding DIC images; the dotted white line in the fluorescent images indicates the outline of the proplatelet from the DIC image. Panel A depicts a proplatelet string with distinct mepacrine-containing compartments (arrows, in insets), and panel B demonstrates a proplatelet string only with puncta that label with both mepacrine and LysoTracker Red (arrowheads, in insets). Scale bars, 5 μm. (C) The number (mean ± SD) of total puncta and puncta labeled by mepacrine alone (mep-only puncta) or by both mepacrine and LysoTracker (coloc. puncta) were quantified per proplatelet string identified as detached or attached as indicated in the text. (D) Quantification of the percentage (mean ± SD) of mepacrine (Mep) labeling colocalized with LysoTracker Red (LyTrR) in detached (n = 42) and attached (n = 30) proplatelets, normalized to 100% for overlap of LysoTracker Red with LysoTracker Green DND-26 (LyTrG) in G1ME2-MK (n = 79). Proplatelets were imaged by spinning-disk confocal microscopy at room temperature with a Leica DMi8 inverted microscope equipped with a Hamamatsu Orca Flash 4 CMOS camera, a 100× Plan Apochromat objective lens (1.4 NA), and VisiVIEW imaging software. Imaging medium was IMDM. Mepacrine has an excitation/emission of 436/525 nm; LysoTracker Red excitation/emission: 577/590 nm. **P < .01. int., intensity.

Similar articles

Cited by

References

    1. Ren Q, Ye S, Whiteheart SW. The platelet release reaction: just when you thought platelet secretion was simple. Curr Opin Hematol. 2008;15(5):537-541. - PMC - PubMed
    1. Heijnen H, van der Sluijs P. Platelet secretory behaviour: as diverse as the granules … or not? J Thromb Haemost. 2015;13(12):2141-2151. - PubMed
    1. Wei AH, Li W. Hermansky-Pudlak syndrome: pigmentary and non-pigmentary defects and their pathogenesis. Pigment Cell Melanoma Res. 2013;26(2):176-192. - PubMed
    1. Nurden A, Nurden P. Advances in our understanding of the molecular basis of disorders of platelet function. J Thromb Haemost. 2011;9(Suppl 1):76-91. - PubMed
    1. Seward SL Jr, Gahl WA. Hermansky-Pudlak syndrome: health care throughout life. Pediatrics. 2013;132(1):153-160. - PubMed