. 2017 Sep 22:6:e26726.
doi: 10.7554/eLife.26726.

Systematic integration of biomedical knowledge prioritizes drugs for repurposing

Affiliations

Systematic integration of biomedical knowledge prioritizes drugs for repurposing

Daniel Scott Himmelstein et al. Elife. .

Abstract

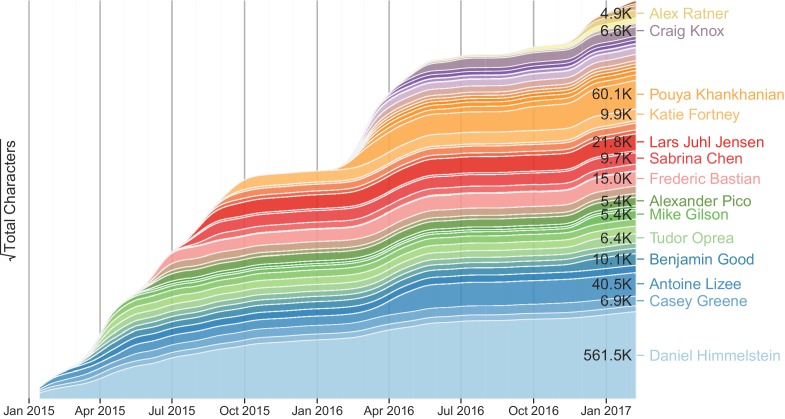
The ability to computationally predict whether a compound treats a disease would improve the economy and success rate of drug approval. This study describes Project Rephetio to systematically model drug efficacy based on 755 existing treatments. First, we constructed Hetionet (neo4j.het.io), an integrative network encoding knowledge from millions of biomedical studies. Hetionet v1.0 consists of 47,031 nodes of 11 types and 2,250,197 relationships of 24 types. Data were integrated from 29 public resources to connect compounds, diseases, genes, anatomies, pathways, biological processes, molecular functions, cellular components, pharmacologic classes, side effects, and symptoms. Next, we identified network patterns that distinguish treatments from non-treatments. Then, we predicted the probability of treatment for 209,168 compound-disease pairs (het.io/repurpose). Our predictions validated on two external sets of treatment and provided pharmacological insights on epilepsy, suggesting they will help prioritize drug repurposing candidates. This study was entirely open and received realtime feedback from 40 community members.

Keywords: computational biology; drug repurposing; heterogeneous networks; human; machine learning; systems biology.


Conflict of interest statement

No competing interests declared.

Figures

Figure 1.
Figure 1.. Hetionet v1.0.
(A) The metagraph, a schema of the network types. (B) The hetnet visualized. Nodes are drawn as dots and laid out orbitally, thus forming circles. Edges are colored by type. (C) Metapath counts by path length. The number of different types of paths of a given length that connect two node types is shown. For example, the top-left tile in the Length 1 panel denotes that Anatomy nodes are not connected to themselves (i.e. no edges connect nodes of this type between themselves). However, the bottom-left tile of the Length 4 panel denotes that 88 types of length-four paths connect Symptom to Anatomy nodes.
Figure 2.
Figure 2.. Performance by type and model coefficients.
(A) The performance of the DWPCs for 1206 metapaths, organized by their composing metaedges. The larger dots represent metapaths that were significantly affected by permutation (false discovery rate < 5%). Metaedges are ordered by their best performing metapath. Since a metapath’s performance is limited by its least informative metaedge, the best performing metapath for a metaedge provides a lower bound on the pharmacologic utility of a given domain of information. (B) Barplot of the model coefficients. Features were standardized prior to model fitting to make the coefficients comparable (Himmelstein and Lizee, 2016a).
Figure 3.
Figure 3.. Predictions performance on four indication sets.
We assess how well our predictions prioritize four sets of indications. (A) The y-axis labels denote the number of indications (+) and non-indications (−) composing each set. Violin plots with quartile lines show the distribution of indications when compound–disease pairs are ordered by their prediction. In all four cases, the actual indications were ranked highly by our predictions. (B) ROC Curves with AUROCs in the legend. (C) Precision–Recall Curves with AUPRCs in the legend.
Figure 4.
Figure 4.. Evidence supporting the repurposing of bupropion for smoking cessation.
This figure shows the 10 most supportive paths (out of 365 total) for treating nicotine dependence with bupropion, as available in this prediction’s Neo4j Browser guide. Our method detected that bupropion targets the CHRNA3 gene, which is also targeted by the known-treatment varenicline (Mihalak et al., 2006). Furthermore, CHRNA3 is associated with nicotine dependence (Thorgeirsson et al., 2008) and participates in several pathways that contain other nicotinic-acetylcholine-receptor (nAChR) genes associated with nicotine dependence. Finally, bupropion causes terminal insomnia (Boshier et al., 2003) as does varenicline (Hays et al., 2008), which could indicate an underlying common mechanism of action.
Figure 5.
Figure 5.. Top 100 epilepsy predictions.
(A) Compounds — ranked from 1 to 100 by their predicted probability of treating epilepsy — are colored by their effect on seizures (Khankhanian and Himmelstein, 2016). The highest predictions are almost exclusively anti-ictogenic. Further down the prediction list, the prevalence of drugs with an ictogenic (contraindication) or unknown (novel repurposing candidate) effect on epilepsy increases. All compounds shown received probabilities far exceeding the null probability of treatment (0.36%). (B) A chemical similarity network of the epilepsy predictions, with each compound’s 2D structure (Himmelstein et al., 2017a). Edges are Compound–resembles–Compound relationships from Hetionet v1.0. Nodes are colored by their effect on seizures. (C) The relative contribution of important drug targets to each epilepsy prediction (Himmelstein et al., 2017a). Specifically, pie charts show how the eight most-supportive drug targets across all 100 epilepsy predictions contribute to individual predictions. Other Targets represents the aggregate contribution of all targets not listed. The network layout is identical to B.
Figure 6.
Figure 6.. The growth the Project Rephetio corpus on Thinklab over time.
This figure shows Project Rephetio contributions by user over time. Each band represented the cumulative contribution of a Thinklab user to discussions in Project Rephetio (Himmelstein and Lizee, 2016v). Users are ordered by date of first contribution. Users who contributed over 4500 characters are named. The square root transformation of characters written per user accentuates the activity of new contributors, thereby emphasizing collaboration and diverse input.

References

    1. Allison DB, Brown AW, George BJ, Kaiser KA. Reproducibility: A tragedy of errors. Nature. 2016;530:27–29. doi: 10.1038/530027a. - DOI - PMC - PubMed
    1. Ashare RL, Kimmey BA, Rupprecht LE, Bowers ME, Hayes MR, Schmidt HD. Repeated administration of an acetylcholinesterase inhibitor attenuates nicotine taking in rats and smoking behavior in human smokers. Translational Psychiatry. 2016;6:e713. doi: 10.1038/tp.2015.209. - DOI - PMC - PubMed
    1. Ashburn TT, Thor KB. Drug repositioning: identifying and developing new uses for existing drugs. Nature Reviews Drug Discovery. 2004;3:673–683. doi: 10.1038/nrd1468. - DOI - PubMed
    1. Ashburner M, Ball CA, Blake JA, Botstein D, Butler H, Cherry JM, Davis AP, Dolinski K, Dwight SS, Eppig JT, Harris MA, Hill DP, Issel-Tarver L, Kasarskis A, Lewis S, Matese JC, Richardson JE, Ringwald M, Rubin GM, Sherlock G. Gene Ontology: tool for the unification of biology. Nature Genetics. 2000;25:25–29. doi: 10.1038/75556. - DOI - PMC - PubMed
    1. Baggerly K. Disclose all data in publications. Nature. 2010;467:401. doi: 10.1038/467401b. - DOI - PubMed

Publication types

LinkOut - more resources