

Energy contribution of NOVA food groups and sociodemographic determinants of ultra-processed food consumption in the Mexican population
- PMID: 28937354
- PMCID: PMC10260747
- DOI: 10.1017/S1368980017002129
Energy contribution of NOVA food groups and sociodemographic determinants of ultra-processed food consumption in the Mexican population
Abstract
Objective: To identify the energy contributions of NOVA food groups in the Mexican diet and the associations between individual sociodemographic characteristics and the energy contribution of ultra-processed foods (UPF).
Design: We classified foods and beverages reported in a 24 h recall according to the NOVA food framework into: (i) unprocessed or minimally processed foods; (ii) processed culinary ingredients; (iii) processed foods; and (iv) UPF. We estimated the energy contribution of each food group and ran a multiple linear regression to identify the associations between sociodemographic characteristics and UPF energy contribution.
Setting: Mexican National Health and Nutrition Survey 2012.
Subjects: Individuals ≥1 years old (n 10 087).
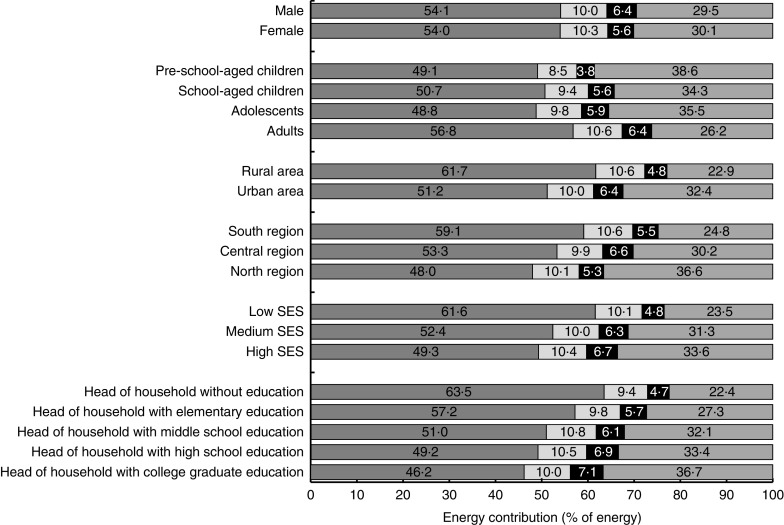
Results: Unprocessed or minimally processed foods had the highest dietary energy contribution (54·0 % of energy), followed by UPF (29·8 %), processed culinary ingredients (10·2 %) and processed foods (6·0 %). The energy contribution of UPF was higher in: pre-school-aged children v. other age groups (3·8 to 12·5 percentage points difference (pp)); urban areas v. rural (5·6 pp); the Central and North regions v. the South (2·7 and 8·4 pp, respectively); medium and high socio-economic status v. low (4·5 pp, in both); and with higher head of household educational level v. without education (3·4 to 7·8 pp).
Conclusions: In 2012, about 30 % of energy in the Mexican diet came from UPF. Our results showed that younger ages, urbanization, living in the North region, high socio-economic status and high head of household educational level are sociodemographic factors related to higher consumption of UPF in Mexico.
Keywords: Energy contribution; Mexico; NOVA; Sociodemographic characteristics; Ultra-processed foods.
Figures
 ), processed culinary ingredients (
 ), processed foods (
 ) and ultra-processed foods (
 ) by sex, age group*, residence area†, region‡, socio-economic status (SES)§ and head of household educational level in the Mexican population (n 10 087), 2012 Mexican National Health and Nutrition Survey (ENSANUT 2012). *Pre-school-aged children: aged <5 years; school-aged children: aged 5–11 years; adolescents: aged 12–19 years; adults: aged ≥20 years. †Rural: <2500 inhabitants; urban: ≥2500 inhabitants. ‡South states: Campeche, Chiapas, Guerrero, Hidalgo, Oaxaca, Puebla, Quintana Roo, Tabasco, Tlaxcala, Veracruz and Yucatán; Central states: Aguascalientes, Colima, Estado de México, Mexico City, Guanajuato, Jalisco, Michoacán, Morelos, Nayarit, Querétaro, San Luis Potosí, Sinaloa and Zacatecas; North states: Baja California, Baja California Sur, Chihuahua, Coahuila, Durango, Nuevo León, Sonora and Tamaulipas. §Tertiles of an index based on household characteristics and basic goods and services
References
-
- Ludwig D (2011) Technology, diet, and the burden of chronic disease. JAMA 305, 1352–1353. - PubMed
-
- Crovetto MM, Uauy R, Martins AP et al.. (2014) Household availability of ready-to-consume food and drink products in Chile: impact on nutritional quality of the diet. Rev Med Chil 142, 850–858. - PubMed
-
- Moubarac J-C, Batal M, Louzada ML et al.. (2017) Consumption of ultra-processed foods predicts diet quality in Canada. Appetite 108, 512–520. - PubMed
MeSH terms
LinkOut - more resources
Full Text Sources
Other Literature Sources
Miscellaneous
