. 2017 Oct;9(10):1025-1033.
doi: 10.1038/nchem.2778. Epub 2017 May 16.

Salinomycin kills cancer stem cells by sequestering iron in lysosomes

Affiliations

Salinomycin kills cancer stem cells by sequestering iron in lysosomes

Trang Thi Mai et al. Nat Chem. 2017 Oct.

Abstract

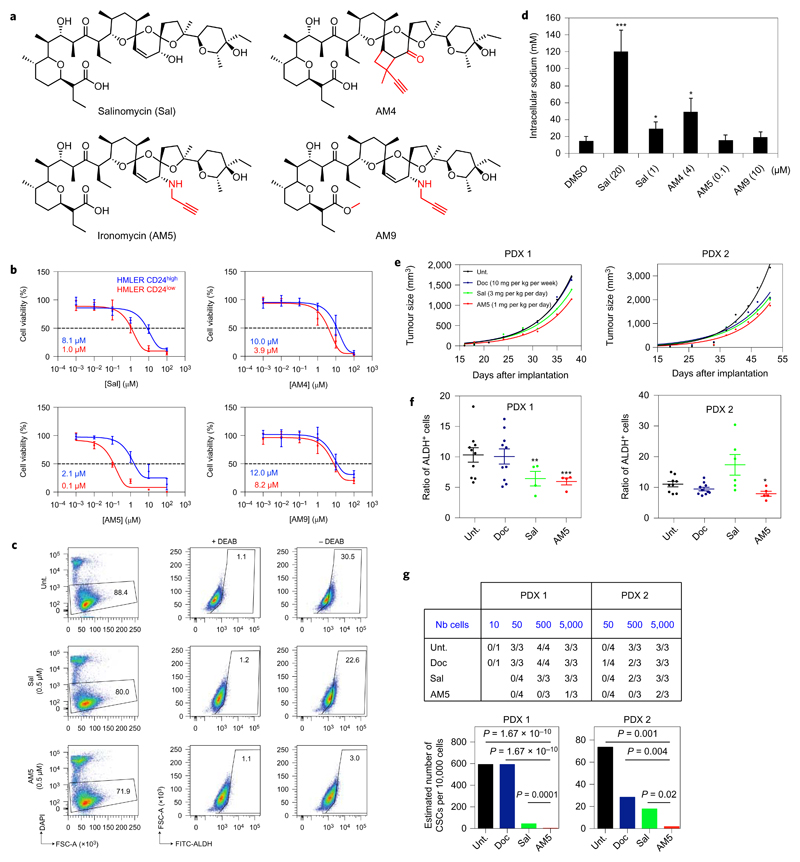
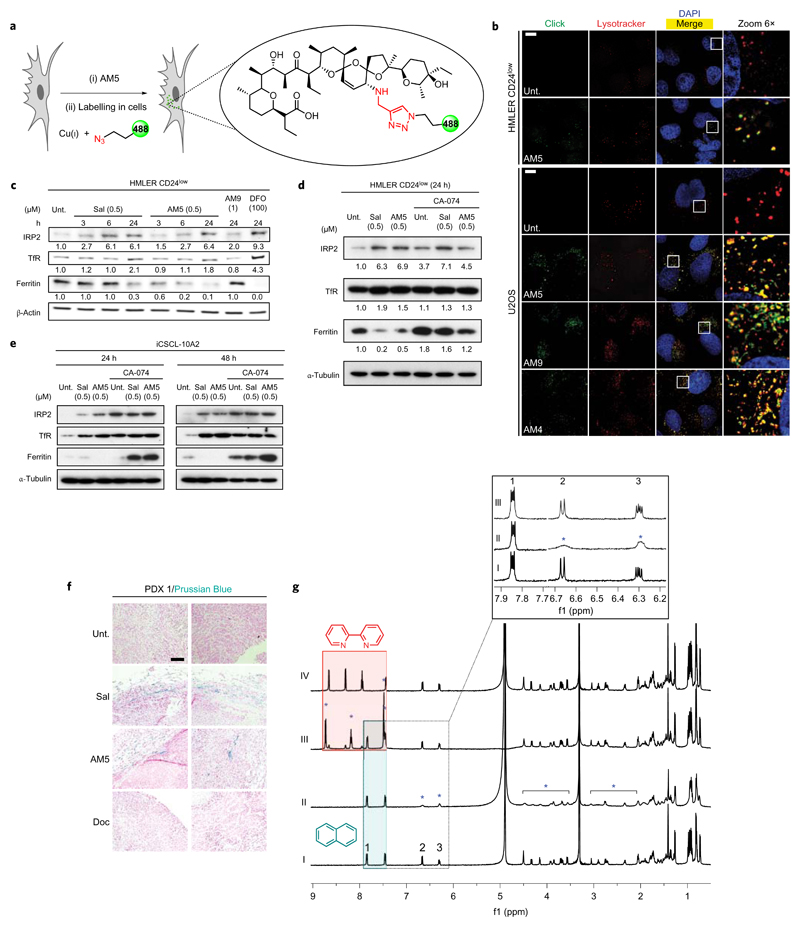
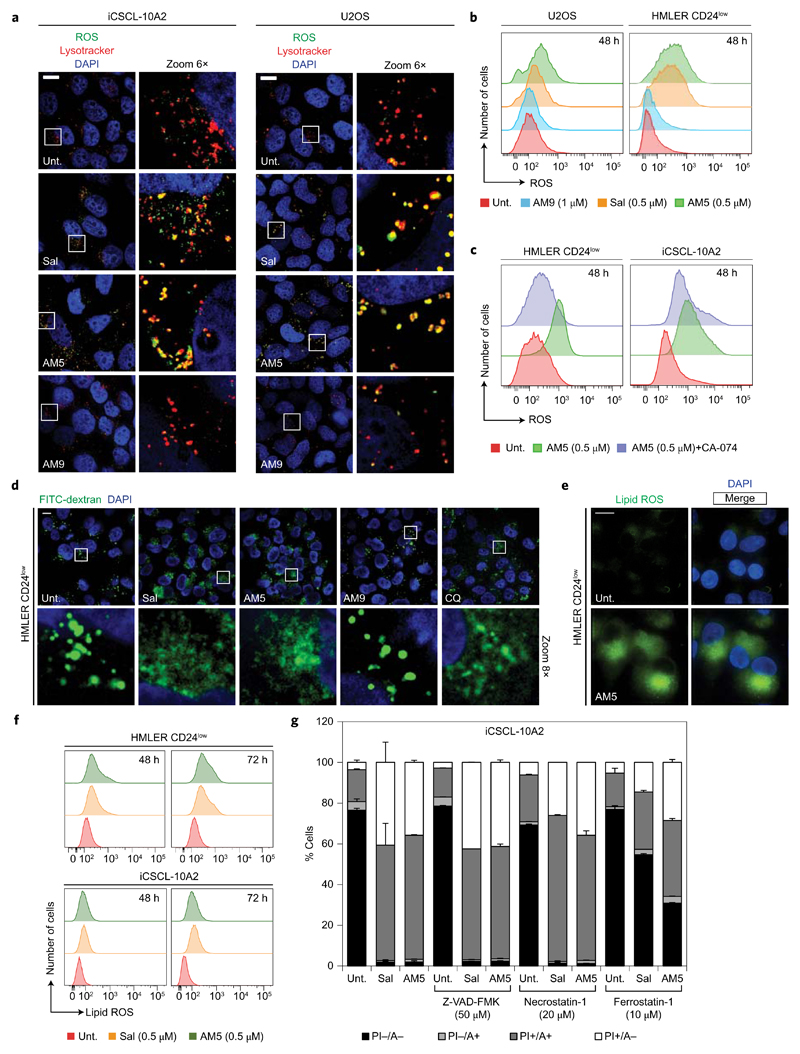
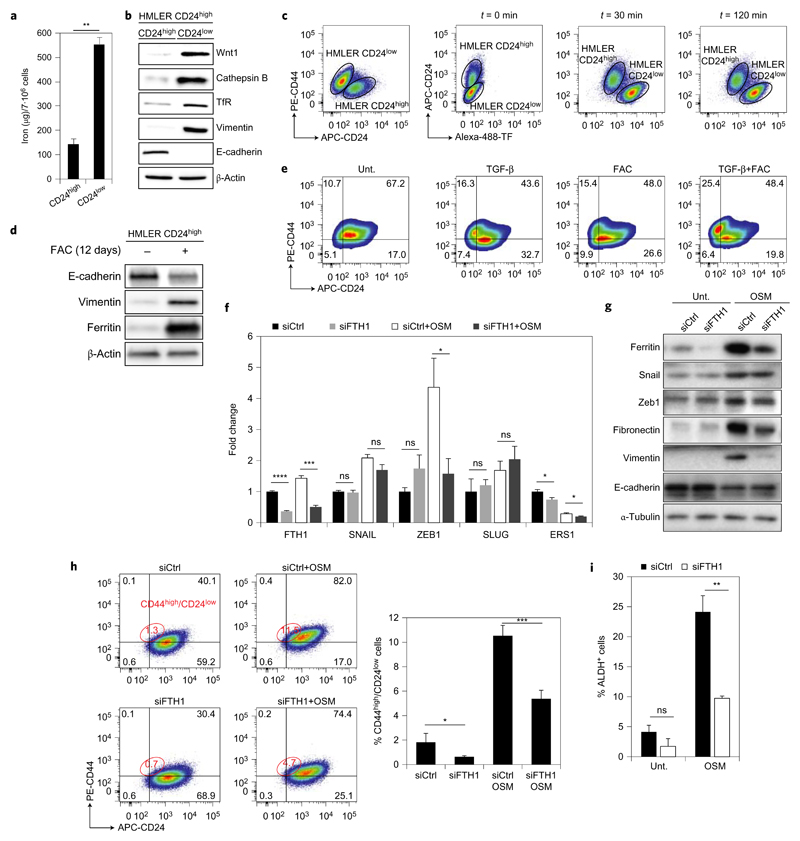
Cancer stem cells (CSCs) represent a subset of cells within tumours that exhibit self-renewal properties and the capacity to seed tumours. CSCs are typically refractory to conventional treatments and have been associated to metastasis and relapse. Salinomycin operates as a selective agent against CSCs through mechanisms that remain elusive. Here, we provide evidence that a synthetic derivative of salinomycin, which we named ironomycin (AM5), exhibits a more potent and selective activity against breast CSCs in vitro and in vivo, by accumulating and sequestering iron in lysosomes. In response to the ensuing cytoplasmic depletion of iron, cells triggered the degradation of ferritin in lysosomes, leading to further iron loading in this organelle. Iron-mediated production of reactive oxygen species promoted lysosomal membrane permeabilization, activating a cell death pathway consistent with ferroptosis. These findings reveal the prevalence of iron homeostasis in breast CSCs, pointing towards iron and iron-mediated processes as potential targets against these cells.


Conflict of interest statement

Competing financial interests

The authors declare no competing financial interests.

Figures

Figure 1
Figure 1. Sal and AM5 alter the maintenance of CSCs independently of sodium transport.
a, Molecular structures of Sal and synthetic derivatives. b, Dose–response viability curves of HMLER CD24low and control cells treated for 72 h as indicated. Data points and error bars, mean values and s.d. of three biological replicates. c, In vitro effect of Sal and AM5 against ALDH+ iCSCL-10A2 cell subpopulation treated for 48 h measured by flow cytometry. DEAB, ALDH inhibitor. d, Quantification of sodium uptake by ratiometric fluorescence in HMLER CD24low cells treated as indicated. Bars and error bars, mean values and s.d. of three biological replicates. e, In vivo antitumour effect of Sal and AM5 against PDX in NOD/scid mice treated as indicated by means of intra-peritoneal injections (n ≥ 4 per condition per PDX). f, Quantification of the proportion of residual ALDH+ cells in PDX treated as in e measured by flow cytometry. Bars and error bars, mean values and s.d. g, Tumour-seeding capacity of cells treated in vivo as in e and estimated number of CSCs calculated by extreme limiting dilution analysis (ELDA) software. P values, χ2 pairwise test. In d,f *P < 0.05, **P < 0.01, ***P < 0.001, Student’s t-test.
Figure 2
Figure 2. Sal and AM5 sequester iron in lysosomes and trigger ferritin degradation in response to iron depletion.
a, Chemical strategy to label small molecules in cells. b, Fluorescence microscopy images showing the subcellular localization of labelled Sal derivatives in cells treated as indicated (10 μM, 6 h). LysoTracker Deep Red stains the lysosomes and 4′,6-diamidino-2-phenylindole (DAPI) stains nuclear DNA. Scale bar, 10 μm. Sal derivatives were labelled by means of click chemistry as described in Methods. c, Immunoblotting showing levels of iron homeostasis regulatory proteins in cells treated as indicated. d,e, Immunoblotting showing levels of ferritin in cells treated as indicated. Data quantified against loading controls. f, Detection of soluble iron using Perls’ Prussian Blue in tumours treated as in Fig. 1e. Data representative of PDX 1. Scale bar, 100 μm. g, 1H-NMR spectra of (I) AM5 (2 mM) and Napht (1.0 mol equiv.); (II) AM5 and Napht in the presence of FeCl2 (0.5 mol equiv.); (III) AM5, Napht and Bipy (1.6 mol equiv.) in the presence of FeCl2 (Bipy added after FeCl2); (IV) AM5 and Bipy. Samples prepared in CD3OD, spectra recorded at 298 K, 5 min following sample preparation (600 MHz). Blue stars indicate proton signals shielded by iron(II), green and red boxes highlight signals of free Napht and free/bound Bipy, respectively.
Figure 3
Figure 3. Accumulation of iron in lysosomes promotes ROS production and lysosomal dysfunction.
a, Fluorescence microscopy images showing the subcellular localization of ROS (green) by means of fluorogenic reaction with CM-H2DCFDA in cells treated with Sal (0.5 μM), AM5 (0.5 μM) or AM9 (1 μM) for 48 h. Scale bar, 10 μm. b,c, Flow cytometry analysis of ROS in cells treated as indicated. d, Fluorescence microscopy images showing the subcellular localization of FITC-dextran (green) in HMLER CD24low cells treated as in a or with chloroquine (CQ) control (100 μM, 3 h). Scale bar, 10 μm. e, Fluorescence microscopy images showing lipid ROS (green) by means of fluorogenic reaction with BODIPY 581/591 C11 in cells treated with AM5 (0.5 μM) at 48 h. Scale bar, 10 μm. f, Flow cytometry analysis of lipid ROS in cells treated as indicated. g, Flow cytometry analysis of Annexin V-FITC (A) and propidium iodide (PI) fluorescence in iCSCL-10A2 cells treated with Sal (0.5 μM) or AM5 (0.5 μM) for 72 h, in the presence or absence of the indicated inhibitors. Living cells are A–/PI– and ferroptotic cells (regulated necrosis) exhibit a positive PI+ staining. Bars and error bars, mean values and s.d. of two biological replicates. For flow cytometry profiles, see Supplementary Fig. 15.
Figure 4
Figure 4. Iron is involved in the maintenance of CSCs.
a, Quantification of cellular iron by electrothermal atomic absorption spectrometry in HMLER cells. Bars and error bars, mean values and s.d. of three biological replicates. b, Comparative immunoblotting analysis of endogenous levels of EMT markers, TfR and cathepsin B in HMLER cells. c, Flow cytometry analysis of Alexa-488-TF uptake in mixed HMLER CD24high/low cells. d, Immunoblotting showing levels of EMT markers in HMLER cells supplemented with FAC for 12 days. e, Flow cytometry analysis of subpopulations of HMLER cells treated as indicated for 12 days. f, qPCR quantification of levels of mRNA transcripts of the indicated genes in control and ferritin knocked down conditions in MCF-7 cells supplemented with OSM for 48 h. Bars and error bars, mean values and s.d. of two biological replicates. g, Comparative immunoblotting analysis of ferritin and EMT markers in MCF-7 cells treated as in f. h, Flow cytometry analysis of subpopulations of MCF-7 cells treated as indicated for 48 h and corresponding quantification. i, Quantification of the ALDH+ population in MCF-7 cells treated as indicated measured by flow cytometry. Bars and error bars, mean values and s.d. of two biological replicates. In a,f,i *P < 0.05, **P < 0.01, ***P < 0.001, ****P < 0.0001, Student’s t-test. ns, not significant.

Similar articles

Cited by

References

    1. Nieto MN, Huang RY-J, Jackson RA, Thiery JP. EMT: 2016. Cell. 2016;166:21–45. - PubMed
    1. Tam WL, Weinberg RA. The epigenetics of epithelial-mesenchymal plasticity in cancer. Nat Med. 2013;19:1438–1449. - PMC - PubMed
    1. Pattabiraman DR, Weinberg RA. Tackling the cancer stem cells–what challenges do they pose? Nature Rev Drug Discov. 2014;13:497–512. - PMC - PubMed
    1. Kelly PN, Dakic A, Adams JM, Nutt SL, Strasser A. Tumor growth need not be driven by rare cancer stem cells. Science. 2007;317:337. - PubMed
    1. Quintana E, et al. Efficient tumour formation by single melanoma cells. Nature. 2008;456:593–598. - PMC - PubMed

Publication types

MeSH terms