OXSA: An open-source magnetic resonance spectroscopy analysis toolbox in MATLAB
- PMID: 28938003
- PMCID: PMC5609763
- DOI: 10.1371/journal.pone.0185356
OXSA: An open-source magnetic resonance spectroscopy analysis toolbox in MATLAB
Abstract
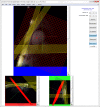
In vivo magnetic resonance spectroscopy provides insight into metabolism in the human body. New acquisition protocols are often proposed to improve the quality or efficiency of data collection. Processing pipelines must also be developed to use these data optimally. Current fitting software is either targeted at general spectroscopy fitting, or for specific protocols. We therefore introduce the MATLAB-based OXford Spectroscopy Analysis (OXSA) toolbox to allow researchers to rapidly develop their own customised processing pipelines. The toolbox aims to simplify development by: being easy to install and use; seamlessly importing Siemens Digital Imaging and Communications in Medicine (DICOM) standard data; allowing visualisation of spectroscopy data; offering a robust fitting routine; flexibly specifying prior knowledge when fitting; and allowing batch processing of spectra. This article demonstrates how each of these criteria have been fulfilled, and gives technical details about the implementation in MATLAB. The code is freely available to download from https://github.com/oxsatoolbox/oxsa.
Conflict of interest statement
Figures


Similar articles
-
NeuroPycon: An open-source python toolbox for fast multi-modal and reproducible brain connectivity pipelines.Neuroimage. 2020 Oct 1;219:117020. doi: 10.1016/j.neuroimage.2020.117020. Epub 2020 Jun 6. Neuroimage. 2020. PMID: 32522662
-
Advanced processing and simulation of MRS data using the FID appliance (FID-A)-An open source, MATLAB-based toolkit.Magn Reson Med. 2017 Jan;77(1):23-33. doi: 10.1002/mrm.26091. Epub 2015 Dec 30. Magn Reson Med. 2017. PMID: 26715192
-
A MATLAB toolbox for Granger causal connectivity analysis.J Neurosci Methods. 2010 Feb 15;186(2):262-73. doi: 10.1016/j.jneumeth.2009.11.020. Epub 2009 Dec 2. J Neurosci Methods. 2010. PMID: 19961876
-
Common processing of in vivo MR spectra.NMR Biomed. 2001 Jun;14(4):224-32. doi: 10.1002/nbm.707. NMR Biomed. 2001. PMID: 11410940 Review.
-
New open-source software for gamma-ray spectra analysis.Appl Radiat Isot. 2022 Jul;185:110227. doi: 10.1016/j.apradiso.2022.110227. Epub 2022 Apr 16. Appl Radiat Isot. 2022. PMID: 35489207 Review.
Cited by
-
Relationship between brain iron deposition and mitochondrial dysfunction in idiopathic Parkinson's disease.Mol Med. 2022 Mar 4;28(1):28. doi: 10.1186/s10020-021-00426-9. Mol Med. 2022. PMID: 35246038 Free PMC article.
-
Quo Vadis Hyperpolarized 13C MRI?Z Med Phys. 2025 Feb;35(1):8-32. doi: 10.1016/j.zemedi.2023.10.004. Epub 2023 Dec 29. Z Med Phys. 2025. PMID: 38160135 Free PMC article. Review.
-
Detection and alterations of acetylcarnitine (AC) in human liver by 1 H MRS at 3T after supplementation with l-carnitine.Magn Reson Med. 2023 Apr;89(4):1314-1322. doi: 10.1002/mrm.29544. Epub 2022 Dec 27. Magn Reson Med. 2023. PMID: 36573435 Free PMC article.
-
Repeatability of deuterium metabolic imaging of healthy volunteers at 3 T.Eur Radiol Exp. 2024 Mar 13;8(1):44. doi: 10.1186/s41747-024-00426-4. Eur Radiol Exp. 2024. PMID: 38472611 Free PMC article.
-
A pathway toward clinical translation of hyperpolarized [1,4-13C2,2,3-d2]fumarate as an imaging biomarker for early cellular necrosis in vivo.Magn Reson Med. 2025 Sep;94(3):1202-1217. doi: 10.1002/mrm.30519. Epub 2025 May 7. Magn Reson Med. 2025. PMID: 40331406 Free PMC article.
References
-
- De Graaf RA (2007) In vivo NMR spectroscopy: principles and techniques. Chichester: John Wiley & Sons.
-
- Valkovic L, Chmelik M, Meyerspeer M, Gagoski B, Rodgers CT, et al. (2016) Dynamic P-31-MRSI using spiral spectroscopic imaging can map mitochondrial capacity in muscles of the human calf during plantar flexion exercise at 7 T. Nmr in Biomedicine 29: 1825–1834. doi: 10.1002/nbm.3662 - DOI - PMC - PubMed
-
- Chmelik M, Považan M, Krššák M, Gruber S, Tkačov M, et al. (2014) In vivo 31P magnetic resonance spectroscopy of the human liver at 7 T: an initial experience. NMR in Biomedicine 27: 478–485. doi: 10.1002/nbm.3084 - DOI - PubMed
-
- Schar M, El-Sharkawy AMM, Weiss RG, Bottomley PA (2010) Triple Repetition Time Saturation Transfer (TRiST) P-31 Spectroscopy for Measuring Human Creatine Kinase Reaction Kinetics. Magn Reson Med 63: 1493–1501. doi: 10.1002/mrm.22347 - DOI - PMC - PubMed
-
- Valkovič L, Bogner W, Gajdošík M, Považan M, Kukurová IJ, et al. (2014) One-dimensional image-selected in vivo spectroscopy localized phosphorus saturation transfer at 7T. Magnetic Resonance in Medicine 72: 1509–1515. doi: 10.1002/mrm.25058 - DOI - PubMed
MeSH terms
Grants and funding
LinkOut - more resources
Full Text Sources
Other Literature Sources

