. 2017 Sep 22;13(9):e1006649.
doi: 10.1371/journal.ppat.1006649. eCollection 2017 Sep.

Intestinal helminth infection drives carcinogenesis in colitis-associated colon cancer

Affiliations

Intestinal helminth infection drives carcinogenesis in colitis-associated colon cancer

Eva Pastille et al. PLoS Pathog. .

Abstract

Inflammatory bowel diseases (IBD) are chronic inflammatory disorders of the gastrointestinal tract, strongly associated with an increased risk of colorectal cancer development. Parasitic infections caused by helminths have been shown to modulate the host's immune response by releasing immunomodulatory molecules and inducing regulatory T cells (Tregs). This immunosuppressive state provoked in the host has been considered as a novel and promising approach to treat IBD patients and alleviate acute intestinal inflammation. On the contrary, specific parasite infections are well known to be directly linked to carcinogenesis. Whether a helminth infection interferes with the development of colitis-associated colon cancer (CAC) is not yet known. In the present study, we demonstrate that the treatment of mice with the intestinal helminth Heligmosomoides polygyrus at the onset of tumor progression in a mouse model of CAC does not alter tumor growth and distribution. In contrast, H. polygyrus infection in the early inflammatory phase of CAC strengthens the inflammatory response and significantly boosts tumor development. Here, H. polygyrus infection was accompanied by long-lasting alterations in the colonic immune cell compartment, with reduced frequencies of colonic CD8+ effector T cells. Moreover, H. polygyrus infection in the course of dextran sulfate sodium (DSS) mediated colitis significantly exacerbates intestinal inflammation by amplifying the release of colonic IL-6 and CXCL1. Thus, our findings indicate that the therapeutic application of helminths during CAC might have tumor-promoting effects and therefore should be well-considered.


Conflict of interest statement

The authors have declared that no competing interests exist.

Figures

Fig 1
Fig 1. H. polygyrus infection leads to the expansion of regulatory T cells in the colon.
BALB/c mice were infected with 200 stage-three larvae (L3) H. polygyrus by oral gavage, and at indicated time points post infection mice were sacrificed. (A) At day 14, representative tissue sections of the colon and the small intestine from naïve mice and H. polygyrus (H.poly) infected mice were fixed and stained with haematoxylin and eosin (H&E) or periodic acid Schiff (PAS) to show pathologic changes. Images show magnification at x200. (B) Goblet cells in PAS stained sections were counted and referred to villi length. Bars represent the mean±SEM of data from one experiment (naïve, n = 2; naïve+H.poly, n = 3). Statistical significance was calculated using unpaired t test (**, p≤ 0.01). (C) At indicated days post infection (dpi), colon from naïve mice and H. polygyrus infected mice were prepared and colon length was measured. Bars represent the mean±SEM of data from 2 independent experiments (naïve, n = 10; naïve+H.poly, n = 5). (D, E) At indicated dpi, mLNs and LPLs of naïve mice and H. polygyrus infected mice were isolated and stained for the expression of CD4, CD103 and intracellular Foxp3. Bars represent the mean±SEM of data from 3 independent experiments (naïve, n = 14; naïve+H.poly, n = 8). (F) To determine the suppressive capacity of Treg in vitro, Foxp3/eGFP mice were infected with 200 L3 H. polygyrus, and at day 10 post infection, CD4+eGFP+ (Foxp3+) T cells (Treg) from mLN of infected or naive mice were sorted. Tregs were co-cultured at a ratio of 1:1 with eFluor-labeled CD4+ responder T cells (Tresp) and with antigen-presenting cells in the presence of a-CD3. Proliferation of Tresp was measured by loss of eFluor dye. Bar diagram represents the proliferation as mean±SEM of 2 independent experiments (naïve, n = 7; H.poly, n = 7). Statistical significance was calculated using one-way ANOVA followed by Tukey's Multiple Comparison Test (*, p≤ 0.05; **, p≤ 0.01; ***, p≤ 0.001).
Fig 2
Fig 2. H. polygyrus infection in the late phase of colitis-associated colon cancer does not impact tumor growth.
(A) Schematic time schedule of H. polygyrus (H.poly) infection and the induction of colitis-associated colon cancer (CAC) in BALB/c mice. After an intraperitoneal injection of the procarcinogen azoxymethane (AOM), 3 cycles of dextran sulfate sodium (DSS) were given via the drinking water. At week 8, mice were infected with 200 stage-three larvae (L3) H. polygyrus by oral gavage, and tumor development was analyzed at week 12. (B) Weight change of naïve mice (unfilled circles), AOM/DSS-treated mice (CAC, black circles) and AOM/DSS-treated H. polygyrus infected mice (CAC+H.poly, grey rectangles) relative to initial body weight during the course of the experiment. The graph shows data from 4 independent experiments (naïve, n = 12; CAC, n = 17; CAC+H.poly, n = 17). (C) Murine endoscopy was performed to obtain representative endoscopic images from the distal colon of CAC and CAC+H.poly mice and to determine tumor scores. Bars represent the mean±SEM of data from 4 experiments (CAC, n = 17; CAC+H.poly, n = 17). (D) Colon from naïve mice, H. polygyrus infected mice, CAC mice and CAC+H.poly mice were prepared to calculate colon weight to length ratios. Data from 4 independent experiments are shown (naïve, n = 12; naïve+H.poly, n = 16; CAC, n = 17; CAC+H.poly, n = 17). Statistical significance was calculated using one-way ANOVA followed by Tukey's Multiple Comparison Test (***, p≤ 0.001).
Fig 3
Fig 3. H. polygyrus infection in the early inflammatory phase of colitis-associated colon cancer increases tumor development.
(A) Schematic time schedule of H. polygyrus (H.poly) infection and the induction of colitis-associated colon cancer (CAC) in BALB/c mice. One day after intraperitoneal injection of the procarcinogen azoxymethane (AOM), mice were infected with 200 stage-three larvae (L3) H. polygyrus by oral gavage. After 6 days, dextran sulfate sodium (DSS) was given via the drinking water. DSS administration was repeated twice, and mice were analyzed at week 12. (B) Weight change of naïve mice (unfilled circles), AOM/DSS-treated mice (CAC, black circles) and AOM/DSS-treated H. polygyrus infected mice (CAC+H.poly, grey rectangles) relative to initial body weight during the course of the experiment. The graph shows data from 5 independent experiments (naïve, n = 12; CAC, n = 24; CAC+H.poly, n = 25). Statistical significance was calculated using two-way ANOVA and Bonferroni posttests (**, p≤ 0.01). (C) Murine endoscopy was performed to obtain representative endoscopic images from the distal colon of CAC and CAC+H.poly mice and to determine tumor scores. Bars represent the mean±SEM of data from 5 experiments (CAC, n = 24; CAC+H.poly, n = 25). Statistical analyses were performed by unpaired t test (**, p≤ 0.01). (D) At week 12, Colon from naïve mice, H. polygyrus infected mice, CAC mice and CAC+H.poly mice were prepared to calculate colon weight to length ratios. LPLs from the colons were isolated and stained for the expression of CD4, CD8, and intracellular Foxp3. Frequencies of (E) CD4+Foxp3+ Tregs, (F) Foxp3+ CD8+ Tregs and (G) CD8+ T cells were determined by flow cytometry and absolute numbers were calculated. Graphs represent the mean±SEM of data from 5 experiments (naïve, n = 12; naïve+H.poly, n = 16; CAC, n = 24; CAC+H.poly, n = 25). Statistical significance was calculated using one-way ANOVA followed by Tukey's Multiple Comparison Test (*, p≤ 0.05; **, p≤ 0.01; ***, p≤ 0.001).
Fig 4
Fig 4. DSS-induced acute colonic inflammation is augmented by H. polygyrus infection.
(A) Schematic time schedule of H. polygyrus (H.poly) infection and induction of dextran sulfate sodium colitis (DSS) in BALB/c mice. At day 1, mice were infected with 200 stage-three larvae (L3) H. polygyrus by oral gavage. Six days later, DSS was given via the drinking water for 7 days and mice were sacrificed on day 15. Weight change (B) of DSS-treated mice (DSS, black circles) and DSS-treated H. polygyrus infected mice (DSS+H.poly, grey rectangles) relative to initial body weight and disease activity index (C) during the course of the experiment. The graph shows data from 2–4 independent experiments (DSS, n = 9–15; DSS+H.poly, n = 9–15). Statistical significance was calculated using two-way ANOVA and Bonferroni posttests (*, p≤ 0.05; **, p≤ 0.01; ***, p≤ 0.01). (D) At day 15 colons were prepared and the length was measured. Box plots represent the median (horizontal lines), 10th to 90th percentile (extension of boxes), and range (error bars) of n = 9–15 mice per group. Statistical significance was calculated using one-way ANOVA followed by Tukey's Multiple Comparison Test (*, p≤ 0.05; ***, p≤ 0.001). (E) At day 15, representative tissue sections of colon samples from DSS mice and DSS+H. poly mice were fixed and stained with haematoxylin and eosin to show pathologic changes. Images show magnification at x200. Severity of colitis was assessed by scoring pathological changes. Bars show the mean ± SEM of the histological score from 2 experiments (DSS, n = 9; DSS+H.poly, n = 8). Statistical analyses were performed by unpaired t test (*, p≤ 0.05). (F) Biopsies from colon samples of naïve mice, H. polygyrus infected mice, DSS mice and DSS+H. poly mice were cultured in vitro for 6 hours in culture medium. Levels of IL-6 and CXCL1 in the supernatants were determined by Luminex. Bars show the mean ± SEM of cytokines per milligram tissue from 3 experiments (naïve, n = 10; naïve+H.poly, n = 12; DSS, n = 11; DSS+H.poly, n = 11). Statistical significance was calculated using one-way ANOVA followed by Tukey's Multiple Comparison Test (*, p≤ 0.05; **, p≤ 0.01; ***, p≤ 0.001).
Fig 5
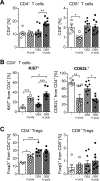
Fig 5. H. polygyrus infection activates colonic effector T cells during DSS-induced acute colitis.
BALB/c mice were infected with H. polygyrus and subjected to acute DSS colitis 6 days later. At day 15, LPLs from the colons of naïve mice, H. polygyrus infected mice, DSS mice and DSS+H. poly mice were isolated and stained for the expression of CD4, CD8, CD62L, and intracellular Ki67 and Foxp3. Frequencies of (A) CD4+ or CD8+ T cells and (B) expression of CD62L and Ki67 were assessed among Foxp3-CD4+ T cells. (C) Frequencies of Foxp3+ among CD4+ T cells or CD8+ T cells were determined by flow cytometry. Bars represent the mean±SEM of data from 3 experiments (naïve, n = 6; naïve+H.poly, n = 7; DSS, n = 9; DSS+H.poly, n = 8). Statistical significance was calculated using one-way ANOVA followed by Tukey's Multiple Comparison Test (*, p≤ 0.05; **, p≤ 0.01; ***, p≤ 0.001).
Fig 6
Fig 6. Gene silencing of IL-6 and CXCL1 ameliorates colonic inflammation in H. polygyrus infected DSS treated animals.
(A) Schematic time schedule of H. polygyrus (H.poly) infection and siRNA treatment during the induction of dextran sulfate sodium colitis (DSS) in BALB/c mice. At day 1, mice were infected with 200 stage-three larvae (L3) H. polygyrus by oral gavage. Six days later, DSS was given via the drinking water for 7 days and mice were sacrificed on day 14. Eight μg siRNA-loaded CaP/PLGA nanoparticles directed against IL-6 and CXCL1 were applied intrarectally daily during DSS treatment until day 13. (B) Disease activity index (DAI) of DSS-treated mice (DSS, black circles), DSS-treated H. polygyrus infected mice (DSS+H.poly, grey rectangles) and siRNA+DSS-treated H. polygyrus infected mice (DSS+H.poly+siRNA, red rectangles) during the course of the experiment. The graph shows data from 1 experiment. Statistical significance was calculated using two-way ANOVA and Bonferroni posttests (**, p≤ 0.01). (C) Representative tissue sections of colon samples from DSS, DSS+H. poly and DSS+H.poly+siRNA mice were fixed and stained with haematoxylin and eosin to show pathologic changes. Images show magnification at x200. (D) At day 14 colons were prepared and biopsies from colon samples were cultured in vitro for 6 hours in culture medium. Levels of IL-6 and CXCL1 in the supernatants were determined by Luminex. Bars show the mean ± SEM of cytokines per milligram tissue from 1 experiment (DSS, n = 5; DSS+H.poly, n = 6; DSS+H.poly+siRNA, n = 5). Statistical significance was calculated using Mann Whitney test (*, p≤ 0.05).
Fig 7
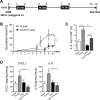
Fig 7. Colitis-associated colon cancer induction impacts the course of H. polygyrus infection.
(A) Schematic time schedule of H. polygyrus (H.poly) infection and CAC induction in BALB/c mice. One day after i.p. injection of azoxymethane (AOM), mice were infected with 200 stage-three larvae (L3) H. polygyrus. After 6 days, dextran sulfate sodium (DSS) was given via the drinking water. DSS administration was repeated twice, and mice were analyzed at week 10 to 12. (B) Fecal egg counts were measured weekly during the course of the experiment until mice were sacrificed at week 10. Mice were graded as recovered when no eggs could be counted in their feces. The graph shows the percentage of recovered mice from 3 experiments with n = 10 H. polygyrus infected mice (open rectangles) and n = 19 CAC+H. polygyrus infected mice (grey rectangles) as survival curve. Statistical significance was calculated using log-rank test (*, p≤0.05). (C) At week 12, LPLs from the colons were isolated and stained for the expression of CD4 and intracellular IL-4. Frequencies of IL-4+ CD4+ T cells were determined by flow cytometry. (D) Colon biopsies were incubated in vitro for 6 hours in culture medium. Levels of IL-6 and CXCL1 in the supernatants were determined by Luminex and cytokines per milligram tissue were calculated. Bars represent the mean±SEM of data from 2–3 experiments (naïve, n = 4; naïve+H.poly, n = 6; CAC, n = 10–15; CAC+H.poly, n = 10–15). Statistical significance was calculated using one-way ANOVA followed by Dunn’s or Tukey's Multiple Comparison Test (*, p≤ 0.05; **, p≤ 0.01; ***, p≤ 0.001).

References

    1. Elinav E, Nowarski R, Thaiss CA, Hu B, Jin C, Flavell RA. Inflammation-induced cancer: crosstalk between tumours, immune cells and microorganisms. Nat Rev Cancer. 2013;13(11):759–71. doi: 10.1038/nrc3611 - DOI - PubMed
    1. Axelrad JE, Lichtiger S, Yajnik V. Inflammatory bowel disease and cancer: The role of inflammation, immunosuppression, and cancer treatment. World J Gastroenterol. 2016;22(20):4794–801. doi: 10.3748/wjg.v22.i20.4794 - DOI - PMC - PubMed
    1. Baumgart DC, Carding SR. Inflammatory bowel disease: cause and immunobiology. Lancet. 2007;369(9573):1627–40. doi: 10.1016/S0140-6736(07)60750-8 - DOI - PubMed
    1. Pedros C, Duguet F, Saoudi A, Chabod M. Disrupted regulatory T cell homeostasis in inflammatory bowel diseases. World J Gastroenterol. 2016;22(3):974–95. doi: 10.3748/wjg.v22.i3.974 - DOI - PMC - PubMed
    1. Pastille E, Bardini K, Fleissner D, Adamczyk A, Frede A, Wadwa M, et al. Transient ablation of regulatory T cells improves antitumor immunity in colitis-associated colon cancer. Cancer Res. 2014;74(16):4258–69. doi: 10.1158/0008-5472.CAN-13-3065 - DOI - PubMed

Supplementary concepts