. 2017 Sep 21;171(1):133-147.e14.
doi: 10.1016/j.cell.2017.08.044.

A Spatial Interactome Reveals the Protein Organization of the Algal CO2-Concentrating Mechanism

Affiliations

A Spatial Interactome Reveals the Protein Organization of the Algal CO2-Concentrating Mechanism

Luke C M Mackinder et al. Cell. .

Abstract

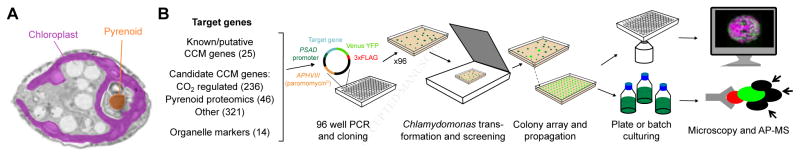
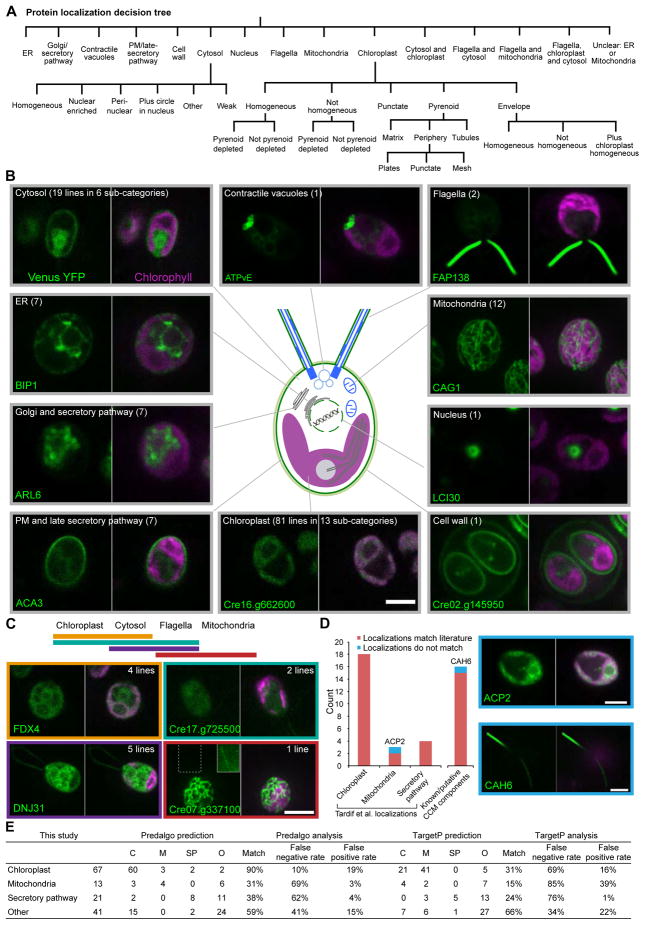
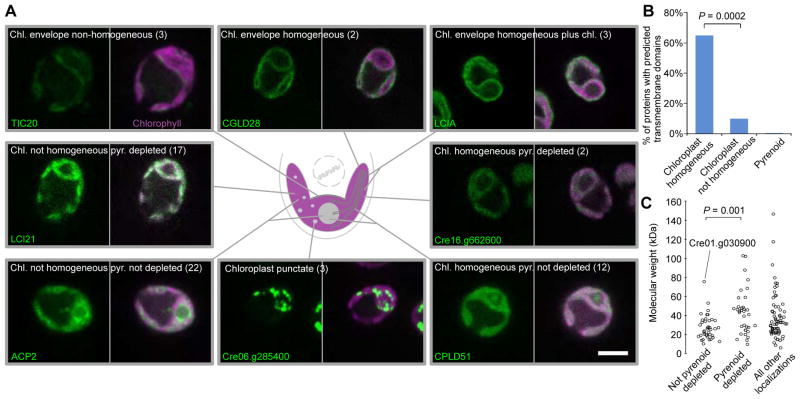
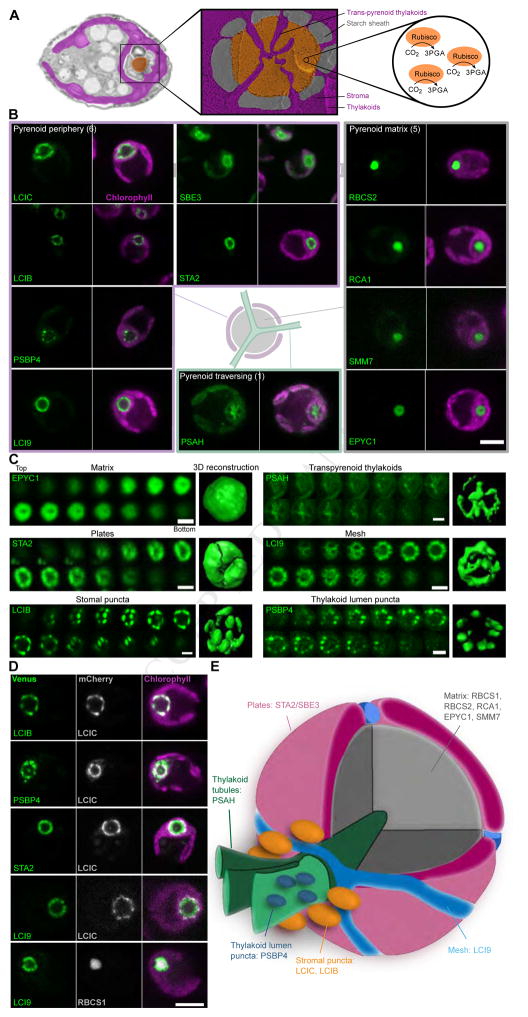
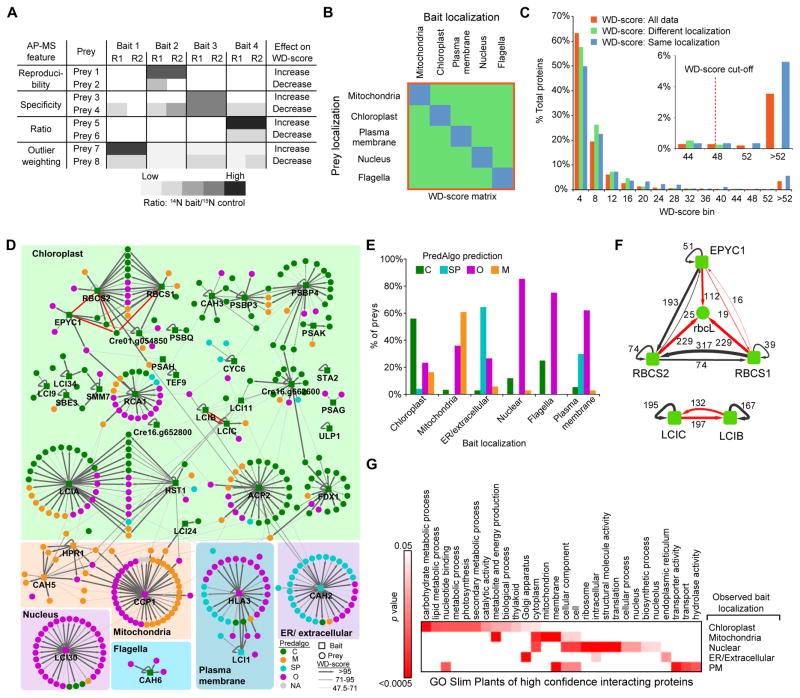
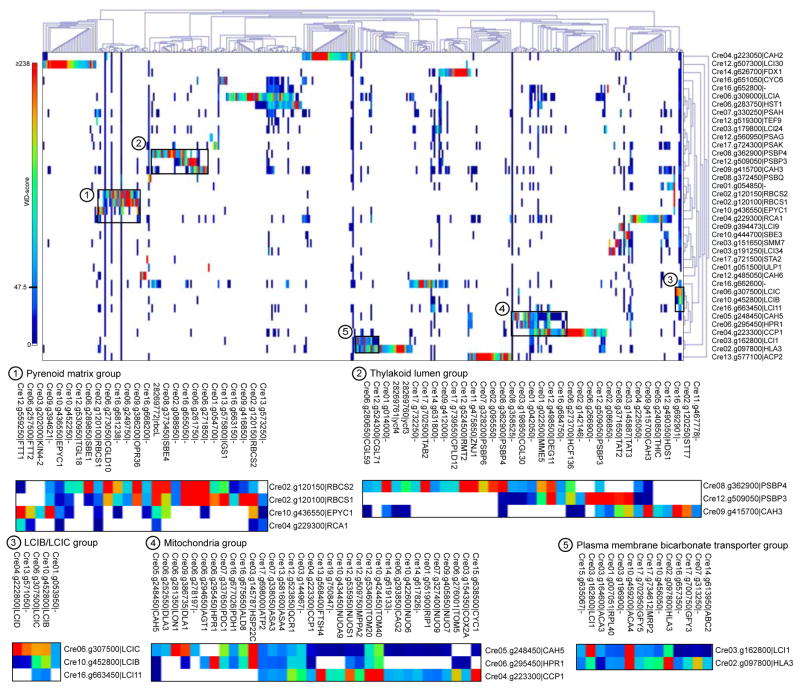
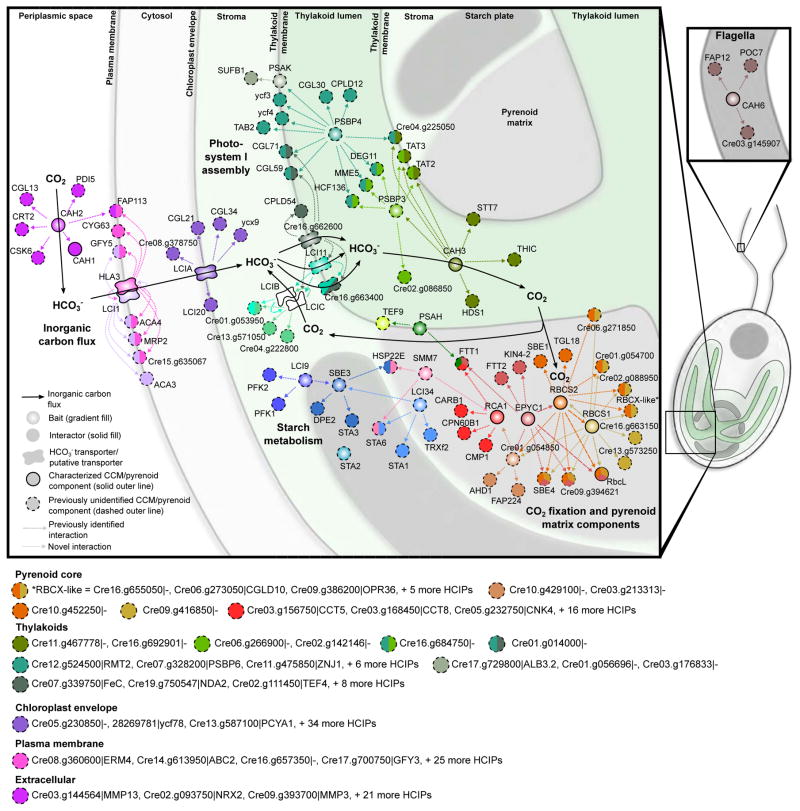
Approximately one-third of global CO2 fixation is performed by eukaryotic algae. Nearly all algae enhance their carbon assimilation by operating a CO2-concentrating mechanism (CCM) built around an organelle called the pyrenoid, whose protein composition is largely unknown. Here, we developed tools in the model alga Chlamydomonas reinhardtii to determine the localizations of 135 candidate CCM proteins and physical interactors of 38 of these proteins. Our data reveal the identity of 89 pyrenoid proteins, including Rubisco-interacting proteins, photosystem I assembly factor candidates, and inorganic carbon flux components. We identify three previously undescribed protein layers of the pyrenoid: a plate-like layer, a mesh layer, and a punctate layer. We find that the carbonic anhydrase CAH6 is in the flagella, not in the stroma that surrounds the pyrenoid as in current models. These results provide an overview of proteins operating in the eukaryotic algal CCM, a key process that drives global carbon fixation.

Keywords: CCM; CO(2)-concentrating mechanism; Chlamydomonas reinhardtii; Rubisco; affinity purification mass spectrometry; carbon fixation; high-throughput fluorescence protein tagging; photosynthesis; pyrenoid.


Figures

Figure 1
Figure 1. We Developed a High-Throughput Pipeline to Determine the Localization and Physical Interactions of Algal Proteins
(A) A false-color transmission electron micrograph of a Chlamydomonas reinhardtii cell. The chloroplast is highlighted in magenta and the pyrenoid matrix in orange. (B) Tagging and mass spectrometry pipeline. Target genes were amplified by PCR and Gibson assembled in frame with Venus-3xFLAG, under the constitutive PSAD promoter. Transformants were screened for fluorescence using a scanner, and arrayed to allow robotic propagation. Lines were either imaged using confocal microscopy to determine their spatial distribution or batch cultured for affinity purification-mass spectrometry (AP-MS).
Figure 2
Figure 2. Tagged Proteins Localized to a Diverse Range of Cellular Locations, and Revealed That CAH6 Localizes to Flagella
(A) A decision tree was used to assign proteins to specific subcellular locations. (B) Representative images of proteins localized to different cellular locations. The number of different lines showing each localization pattern is in parentheses. (C) Representative images of proteins that localized to more than one compartment. The solid outer line inset in the Cre07.g337100 image is an overexposure of the region surrounded by a dashed line, to highlight flagellar fluorescence. (D) Comparison of our observations with published localizations. Images show the two proteins that did not match their published locations. All scale bars: 5 μm. (E) Comparison of our observations with localizations predicted by PredAlgo and TargetP.
Figure 3
Figure 3. Chloroplast Proteins Show 13 different Localization Patterns
(A) Representative images of proteins localized to different chloroplast regions. The number of proteins showing each pattern is in parentheses. Scale bar: 5 μm. (B) The percentage of proteins with predicted transmembrane domains is shown for different localization patterns. Bracket shows a significant difference using Fisher’s exact test. (C) Predicted molecular weight of proteins is shown as a function of pyrenoid signal intensity. Cre01.g030900 that has a pyrenoid signal and is above the 50 kDa cut-off is labeled. Bracket shows significant difference using a Mann-Whitney U test.
Figure 4
Figure 4. Pyrenoid Proteins Show at Least Six Distinct Localization Patterns and Reveal Three New Protein Layers
(A) A false-color transmission electron micrograph and deep-etched freeze-fractured image of the pyrenoid highlight the pyrenoid tubules, starch sheath and pyrenoid matrix where the principal carbon fixing enzyme, Rubisco, is located. Images courtesy of Moritz Meyer, Ursula Goodenough and Robyn Roth. (B) Proteins showing various localization patterns within the pyrenoid are illustrated. Scale bar: 5 μm. (C) Confocal sections distinguish different localization patterns within the pyrenoid. Each end panel is a space-filling reconstruction. Scale bars: 2 μm. (D) Dual tagging refined the spatial distribution of proteins in the pyrenoid. Scale bar: 5 μm. (E) A proposed pyrenoid model highlighting the distinct spatial protein-containing regions.
Figure 5
Figure 5. The AP-MS Data are of High Quality
(A) Illustration of the influence of different AP-MS features (reproducibility, specificity, ratio and outlier weighting) on the WD-score. R1 and R2 represent replica 1 and 2. (B) To determine a WD-score cut-off value, a bait-prey matrix of WD-scores was formed containing only baits and preys whose localizations were determined in this study. The WD-scores from this matrix were then used to generate (C). (C) A histogram of WD-scores for “All data,” “Different localization,” “Same localization.” A conservative WD-score cut-off was chosen as the point where all data fell above the highest “Different localization” WD-score. Proteins with a WD-score greater than the cut-off are classified as high confidence interacting proteins (HCIPs). (D) Protein-protein interaction network of baits and HCIPs. Bait proteins are grouped according to their localization pattern as determined by confocal microscopy. Baits and preys are colored based on their predicted localization by PredAlgo. Previously known interactions are indicated by red arrows. (E) Comparison of prey PredAlgo predictions with bait localization. C, chloroplast; SP, secretory pathway; O, Other; M, mitochondria. (F) Confirmation of known interactions from the literature (red arrows). Values are WD-scores. (G) Significantly enriched gene ontology (GO) terms for interactors of baits localized to different cellular structures.
Figure 6
Figure 6. The AP-MS Data Reveals Previously Undescribed Physical Interactions, Including That Inorganic Carbon Transporters LCI1 and HLA3 Form a Physical Complex
Hierarchical clustering of all 38 baits with 398 HCIP preys. Specific groups of interest are boxed and highlighted below. Clustering of all baits and preys with interaction WD-scores ≥ 1 is provided in Figure S5.
Figure 7
Figure 7. Combining Localization, Protein-Protein Interaction and Protein Function Data Reveals a Spatially Defined Interactome of the Chlamydomonas CCM
A spatially defined protein-protein interaction model of the CCM. Baits have a gradient fill, prey have a solid fill. Each bait has a unique color. Prey are colored according to their bait, with proteins that interact with multiple baits depicted as pies with each slice colored according to one of their interacting baits. Interactors are connected to their bait by a dashed line representing the direction of interaction. Baits are arranged based on their localization observed in this study. Interactors with predicted transmembrane domains are placed on membranes. Prey of membrane localized baits lacking transmembrane domains are arranged according to their PredAlgo localization prediction. Solid black arrows indicate inorganic flux through the cell. For clarity, a selection of interactors are not included in the map but are highlighted below. All interaction data with corresponding WD-scores can be found in Table S5.

Comment in

References

    1. Atkinson N, Feike D, Mackinder L, Meyer MT, Griffiths H, Jonikas MC, Smith AM, McCormick AJ. Introducing an algal carbon-concentrating mechanism into higher plants: location and incorporation of key components. Plant Biotechnol J. 2016;14:1302–1315. - PMC - PubMed
    1. Atteia A, Adrait A, Brugière S, Tardif M, Van Lis R, Deusch O, Dagan T, Kuhn L, Gontero B, Martin W. A proteomic survey of Chlamydomonas reinhardtii mitochondria sheds new light on the metabolic plasticity of the organelle and on the nature of the α-proteobacterial mitochondrial ancestor. Mol Biol Evol. 2009;26:1533–1548. - PubMed
    1. Badger M. The roles of carbonic anhydrases in photosynthetic CO2 concentrating mechanisms. Photosynthesis Res. 2003;77:83–94. - PubMed
    1. Bauwe H, Hagemann M, Fernie AR. Photorespiration: players, partners and origin. Trends Plant Sci. 2010;15:330–336. - PubMed
    1. Behrends C, Sowa ME, Gygi SP, Harper JW. Network organization of the human autophagy system. Nature. 2010;466:68–76. - PMC - PubMed

MeSH terms