

Anesthesia with Dexmedetomidine and Low-dose Isoflurane Increases Solute Transport via the Glymphatic Pathway in Rat Brain When Compared with High-dose Isoflurane
- PMID: 28938276
- PMCID: PMC5685871
- DOI: 10.1097/ALN.0000000000001888
Anesthesia with Dexmedetomidine and Low-dose Isoflurane Increases Solute Transport via the Glymphatic Pathway in Rat Brain When Compared with High-dose Isoflurane
Abstract
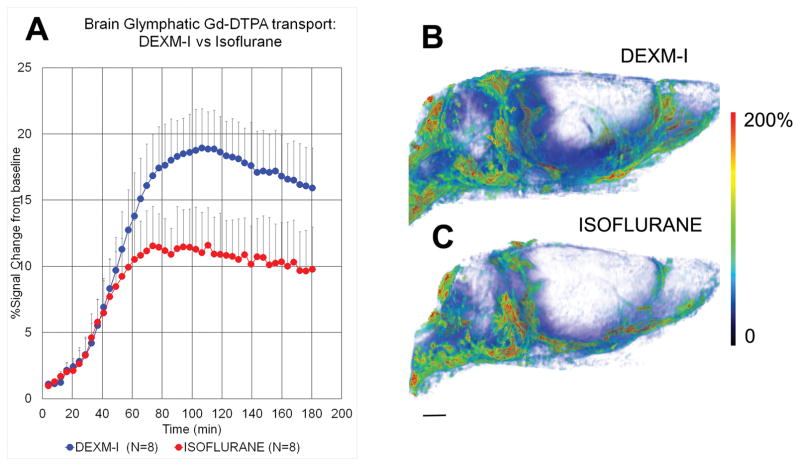
Background: The glymphatic pathway transports cerebrospinal fluid through the brain, thereby facilitating waste removal. A unique aspect of this pathway is that its function depends on the state of consciousness of the brain and is associated with norepinephrine activity. A current view is that all anesthetics will increase glymphatic transport by inducing unconsciousness. This view implies that the effect of anesthetics on glymphatic transport should be independent of their mechanism of action, as long as they induce unconsciousness. We tested this hypothesis by comparing the supplementary effect of dexmedetomidine, which lowers norepinephrine, with isoflurane only, which does not.
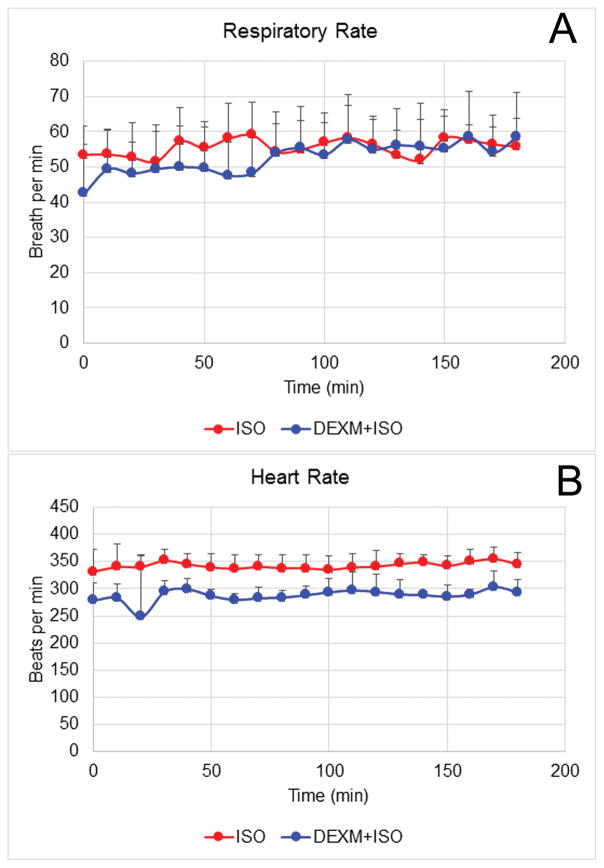
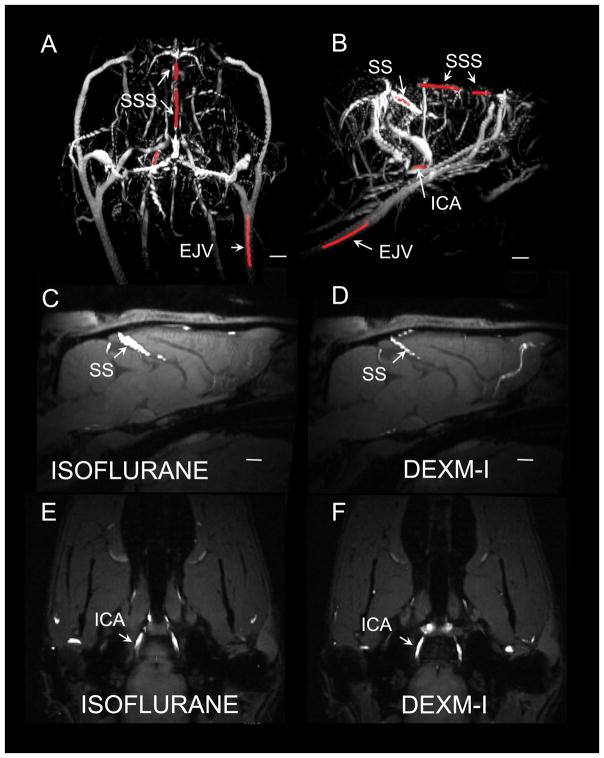
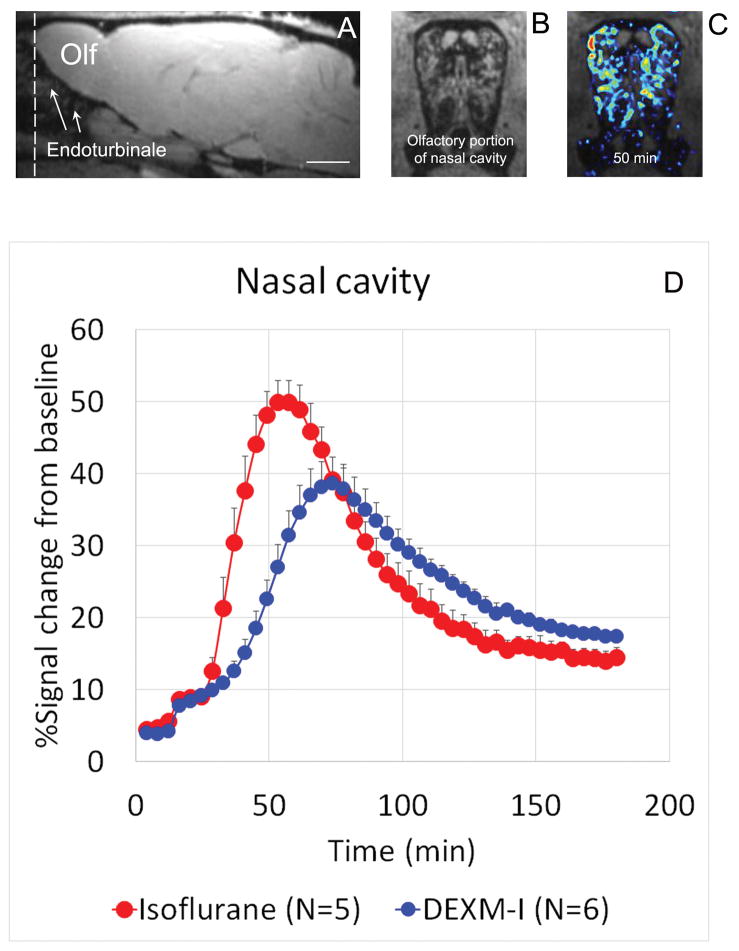
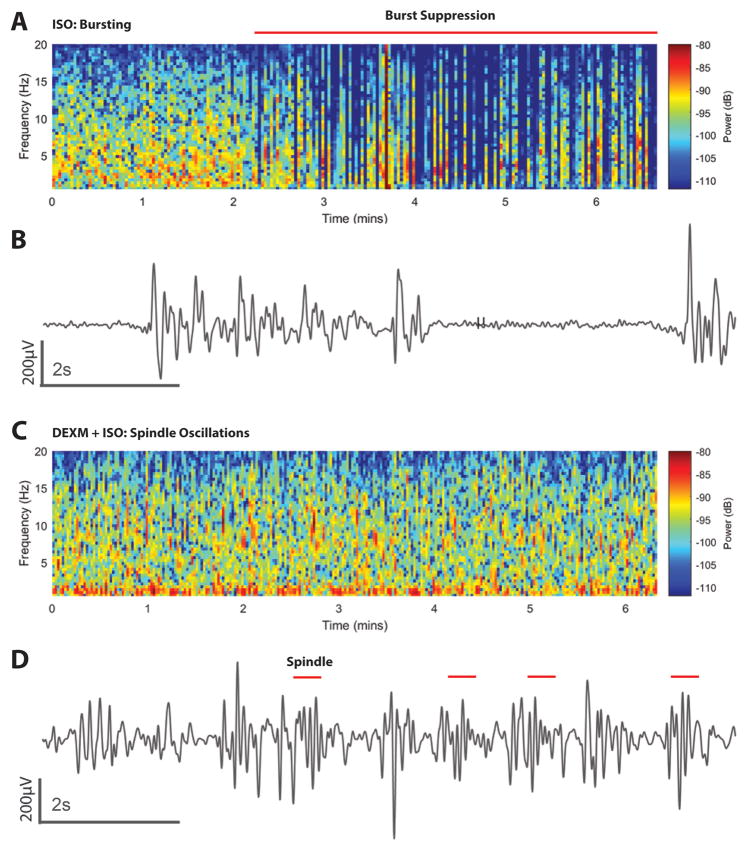
Methods: Female rats were anesthetized with either isoflurane (N = 8) or dexmedetomidine plus low-dose isoflurane (N = 8). Physiologic parameters were recorded continuously. Glymphatic transport was quantified by contrast-enhanced magnetic resonance imaging. Cerebrospinal fluid and gray and white matter volumes were quantified from T1 maps, and blood vessel diameters were extracted from time-of-flight magnetic resonance angiograms. Electroencephalograms were recorded in separate groups of rats.
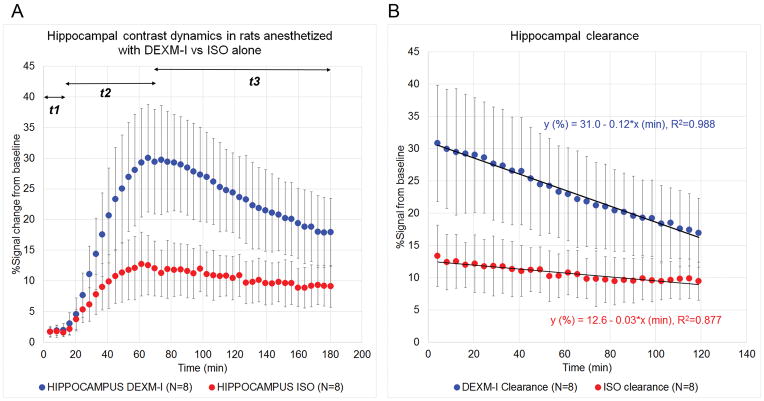
Results: Glymphatic transport was enhanced by 32% in rats anesthetized with dexmedetomidine plus low-dose isoflurane when compared with isoflurane. In the hippocampus, glymphatic clearance was sixfold more efficient during dexmedetomidine plus low-dose isoflurane anesthesia when compared with isoflurane. The respiratory and blood gas status was comparable in rats anesthetized with the two different anesthesia regimens. In the dexmedetomidine plus low-dose isoflurane rats, spindle oscillations (9 to 15 Hz) could be observed but not in isoflurane anesthetized rats.
Conclusions: We propose that anesthetics affect the glymphatic pathway transport not simply by inducing unconsciousness but also by additional mechanisms, one of which is the repression of norepinephrine release.
Conflict of interest statement
Figures
Similar articles
-
Disparate volumetric fluid shifts across cerebral tissue compartments with two different anesthetics.Fluids Barriers CNS. 2021 Jan 6;18(1):1. doi: 10.1186/s12987-020-00236-x. Fluids Barriers CNS. 2021. PMID: 33407650 Free PMC article.
-
Brain interstitial fluid drainage and extracellular space affected by inhalational isoflurane: in comparison with intravenous sedative dexmedetomidine and pentobarbital sodium.Sci China Life Sci. 2020 Sep;63(9):1363-1379. doi: 10.1007/s11427-019-1633-3. Epub 2020 Mar 3. Sci China Life Sci. 2020. PMID: 32133594
-
Physiological characterization of a robust survival rodent fMRI method.Magn Reson Imaging. 2017 Jan;35:54-60. doi: 10.1016/j.mri.2016.08.010. Epub 2016 Aug 28. Magn Reson Imaging. 2017. PMID: 27580522
-
Comparison of medetomidine and dexmedetomidine as premedicants in dogs undergoing propofol-isoflurane anesthesia.Am J Vet Res. 2001 Jul;62(7):1073-80. doi: 10.2460/ajvr.2001.62.1073. Am J Vet Res. 2001. PMID: 11453483
-
Could dexmedetomidine be repurposed as a glymphatic enhancer?Trends Pharmacol Sci. 2022 Dec;43(12):1030-1040. doi: 10.1016/j.tips.2022.09.007. Epub 2022 Oct 21. Trends Pharmacol Sci. 2022. PMID: 36280451 Review.
Cited by
-
The glymphatic hypothesis: the theory and the evidence.Fluids Barriers CNS. 2022 Feb 3;19(1):9. doi: 10.1186/s12987-021-00282-z. Fluids Barriers CNS. 2022. PMID: 35115036 Free PMC article. Review.
-
Nighttime dexmedetomidine for delirium prevention in non-mechanically ventilated patients after cardiac surgery (MINDDS): A single-centre, parallel-arm, randomised, placebo-controlled superiority trial.EClinicalMedicine. 2022 Dec 24;56:101796. doi: 10.1016/j.eclinm.2022.101796. eCollection 2023 Feb. EClinicalMedicine. 2022. PMID: 36590787 Free PMC article.
-
The Bidirectional Link Between Sleep Disturbances and Traumatic Brain Injury Symptoms: A Role for Glymphatic Dysfunction?Biol Psychiatry. 2022 Mar 1;91(5):478-487. doi: 10.1016/j.biopsych.2021.06.025. Epub 2021 Jul 14. Biol Psychiatry. 2022. PMID: 34481662 Free PMC article. Review.
-
Fisher-Rao Regularized Transport Analysis of the Glymphatic System and Waste Drainage.Med Image Comput Comput Assist Interv. 2020 Oct;12267:573-582. doi: 10.1007/978-3-030-59728-3_56. Epub 2020 Sep 29. Med Image Comput Comput Assist Interv. 2020. PMID: 33415322 Free PMC article.
-
Impaired brain glymphatic flow in experimental hepatic encephalopathy.J Hepatol. 2019 Jan;70(1):40-49. doi: 10.1016/j.jhep.2018.08.021. Epub 2018 Sep 8. J Hepatol. 2019. PMID: 30201461 Free PMC article.
References
-
- Iliff JJ, Wang M, Liao Y, Plogg BA, Peng W, Gundersen GA, Benveniste H, Vates GE, Deane R, Goldman SA, Nagelhus EA, Nedergaard M. A paravascular pathway facilitates CSF flow through the brain parenchyma and the clearance of interstitial solutes, including amyloid beta. Sci Transl Med. 2012;4:147ra111. - PMC - PubMed
Publication types
MeSH terms
Substances
Grants and funding
LinkOut - more resources
Full Text Sources
Other Literature Sources
